
Emergencies and communications
Last updated: May 5, 2026
Introduction to Assistance Analytics
The Assistance analytics category provides insights into emergency handling and communication with users. This category helps analyze past emergencies in terms of frequency, resolution time, and location, allowing you to identify areas for improvement in emergency response and communication.
The Assistance category is divided into two main tabs:
Emergencies
Messages
Emergencies Tab
The Emergencies tab contains data on the number and location of emergencies that have occurred within your organization. This information helps track trends in emergency events and response management.
Filtering Options
You can customize the data in the Emergencies tab using the following filters:
Account filter: Filter emergency data by account.
Group: Filter emergency data by user groups.
Tags: Filter emergency data by user tags.
Minutes to Resolve: Filter emergencies based on the time taken to resolve them, from when they were initiated until marked as resolved.
Time range: Specifies the time period you are viewing.
Time Scale: Adjusts the display of emergency data in the "User Alert Timeline" based on daily, weekly, monthly, quarterly, or yearly intervals.
KPIs
Key performance indicators (KPIs) for the Emergencies tab include:
Emergencies: Total number of times users triggered the emergency button in the Safeture app.
Average Resolve Time (min): The average time, in minutes, it took to resolve an emergency from the moment it was initiated.
Maximum Resolve Time (min): The longest time it took to resolve an emergency during the selected period.
Emergencies per 1,000 PNRs: Number of emergencies relative to every 1,000 Passenger Name Records (PNRs).
Call Outs to Local Emergency: Number of times users called a local emergency number (e.g., 112, 911) through the app, which are excluded from other KPIs.
Charts
Emergencies Over Time: A time-based chart showing the total number of emergencies, allowing you to track changes and trends in emergency incidents.
Emergency Locations: A map view showing the geographical locations of emergencies. By hovering over a location, you can see details such as the date, time, and resolution duration, offering insights into areas where risk prevention may be needed.
Emergency Case Resolution Log:
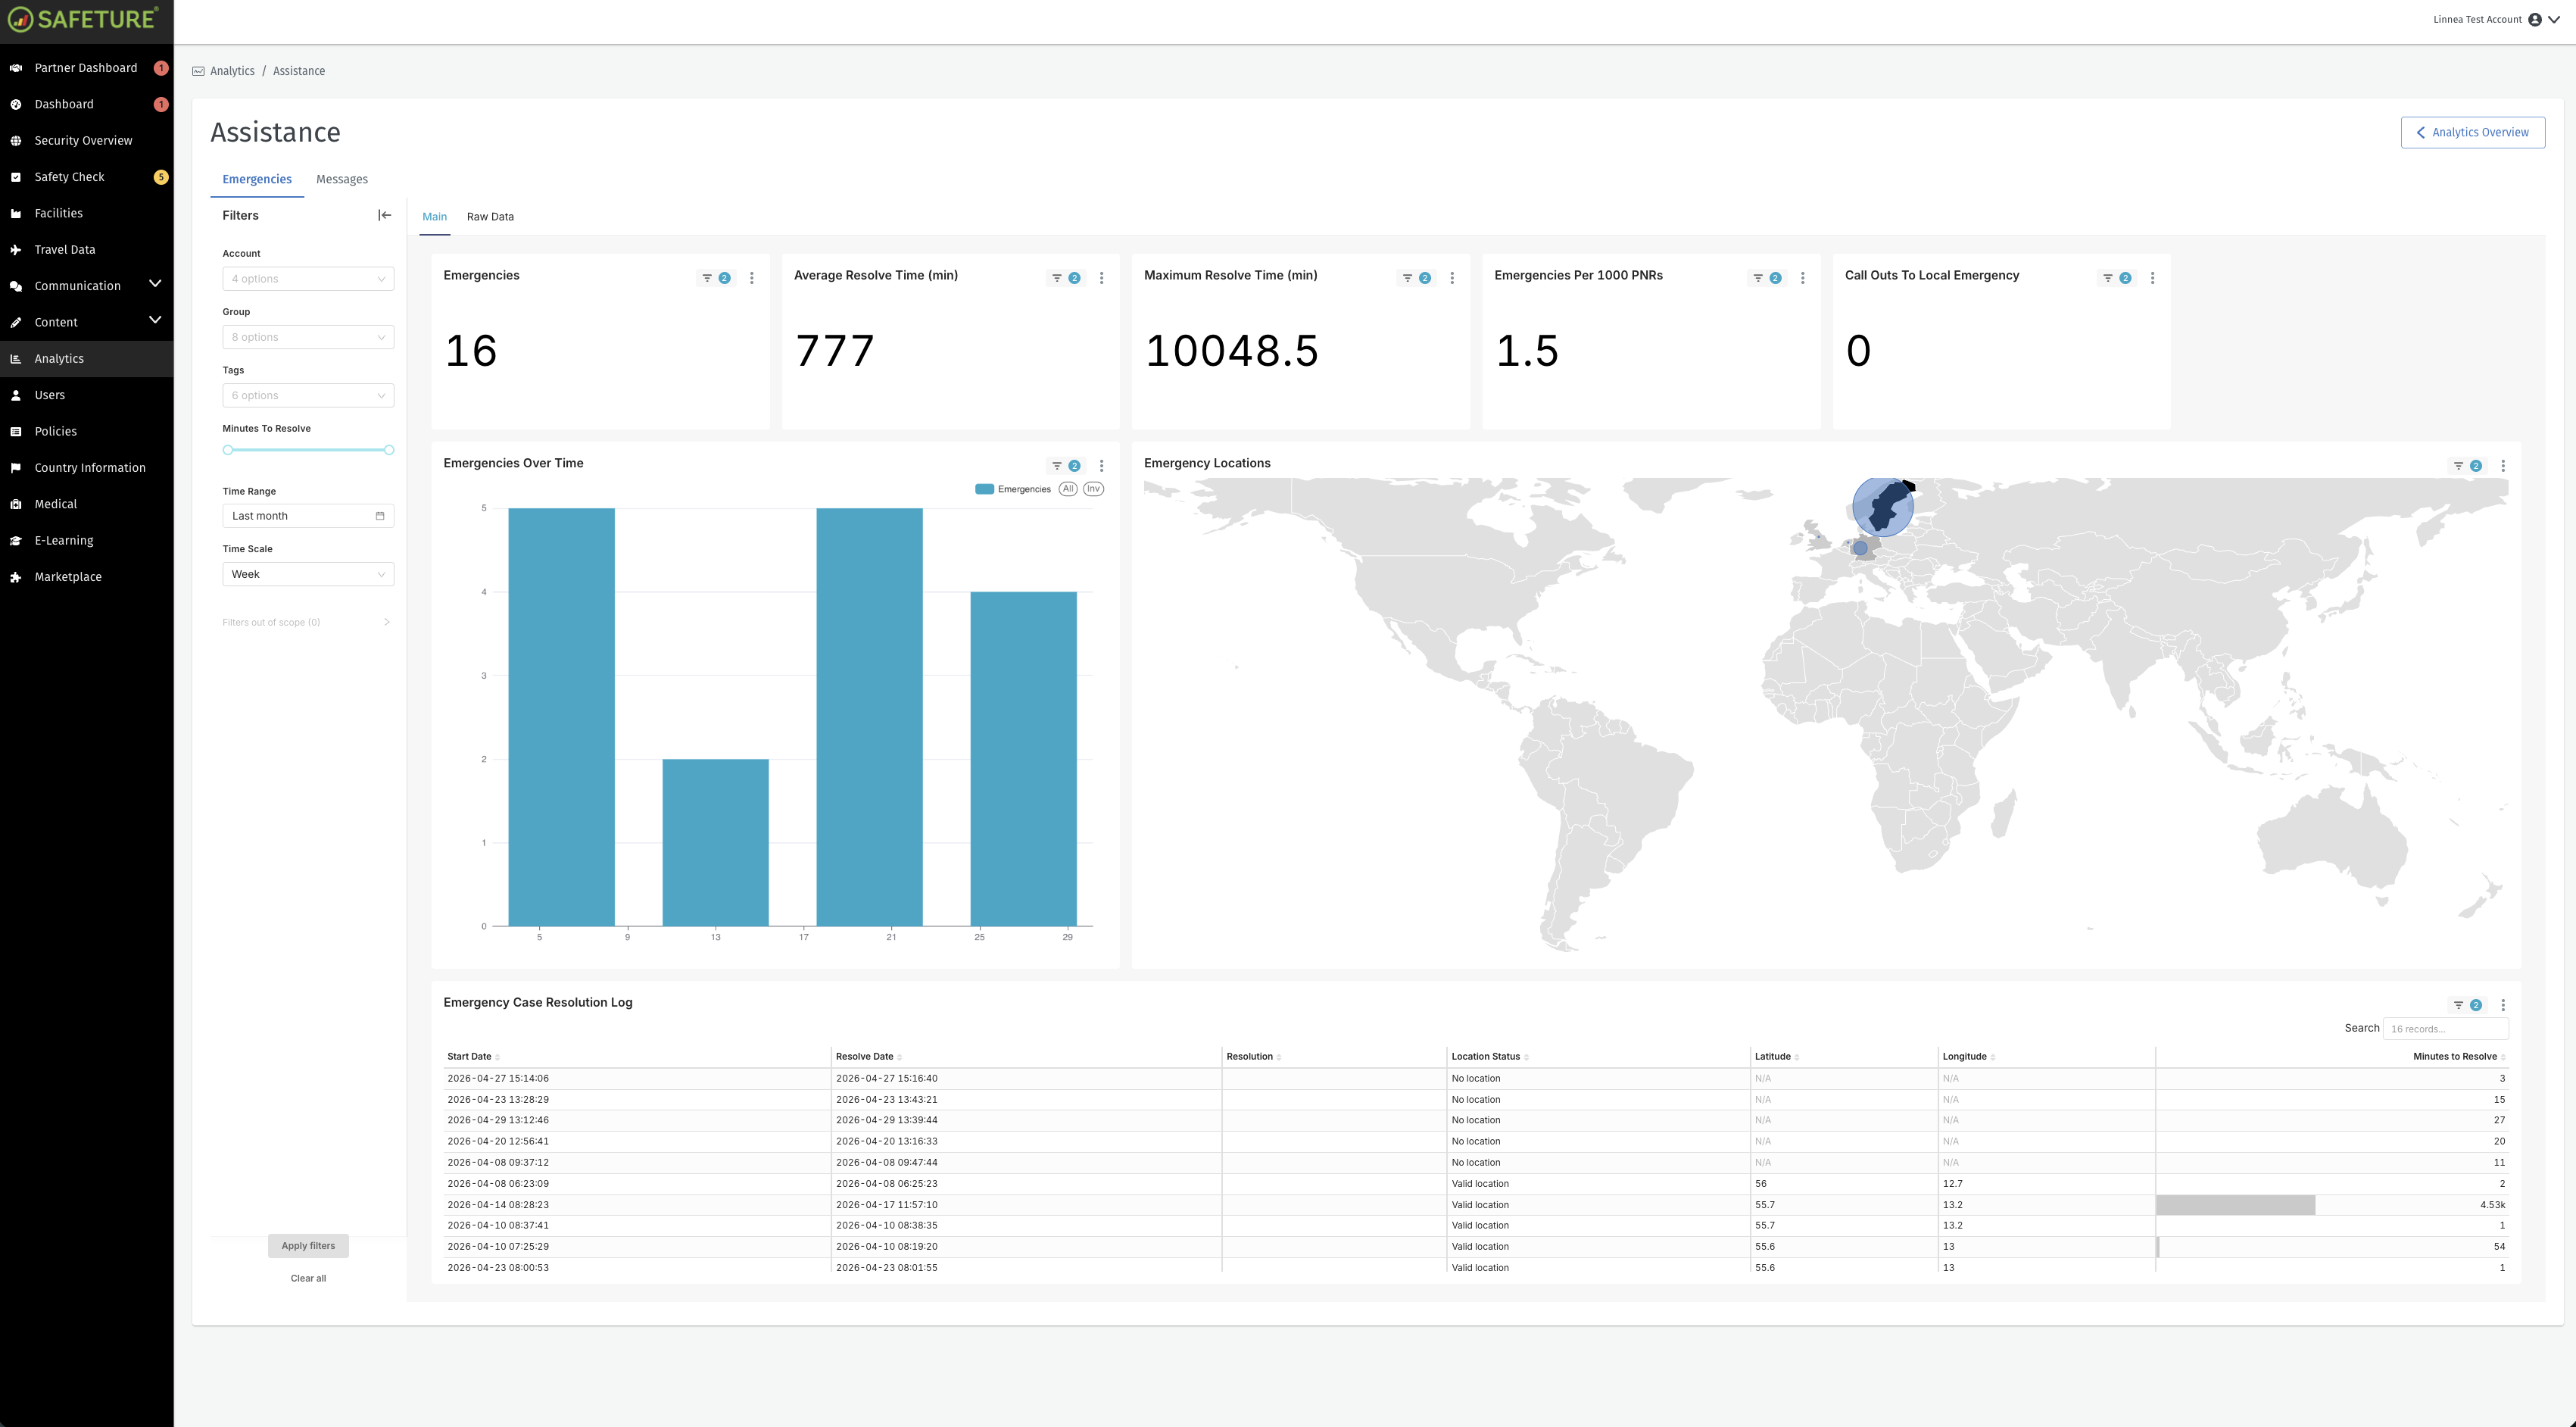
Assistance data in the Analytics Module
Messages Tab
The Messages tab provides data on the volume and types of communication sent through the Safeture platform, whether manual (Admin-generated) or automatic (system-generated).
Filtering Options
The Messages tab includes filtering options such as:
Account: Filters data by account
Group: Filters data by user groups.
Tags: Filters data by tags
Sender Type: Filters messages based on whether they were sent by an Admin using the Communication Module or triggered automatically by the system (e.g., pre-trip notifications or incident alerts).
Delivery Status: Filters messages based on whether they were successfully delivered or not.
Time Scale: Specifies how alert data is displayed in the User Alert Timeline chart. You can choose to view data by specific time intervals like daily, weekly or monthly.
Time Range: Specifies the time period you are viewing.
KPIs
In the cards above the charts, you’ll find key performance indicators. The Messages tab KPIs include:
App Push Messages: Total number of push notifications sent to users through the app, triggered automatically by the system when users need to be alerted about nearby incidents.
Emails Sent: Total number of emails sent, whether manually by an Admin or triggered by the system (e.g., pre-trip information emails).
SMS Sent: Number of SMS messages sent manually or automatically. Hovering over this KPI will also display the number of "Welcome to" SMS messages, which users receive when entering a new country.
SMS Delivery failed:
“Welcome to” app push messages: The number of “Welcome to Country”-app push messages sent to users entering a new country.
“Welcome to” Emails sent: The number of “Welcome to Country”-emails sent to users entering a new country.
“Welcome to” SMS sent: The number of “Welcome to Country”-SMS messages sent to users entering a new country.
Charts
Messages Over Time: Shows the number of messages delivered successfully and unsuccessfully over time for different message types, including App Push Messages, Emails, and SMS.
Message Types Over Time: Shows trends in message frequency by type and channels.
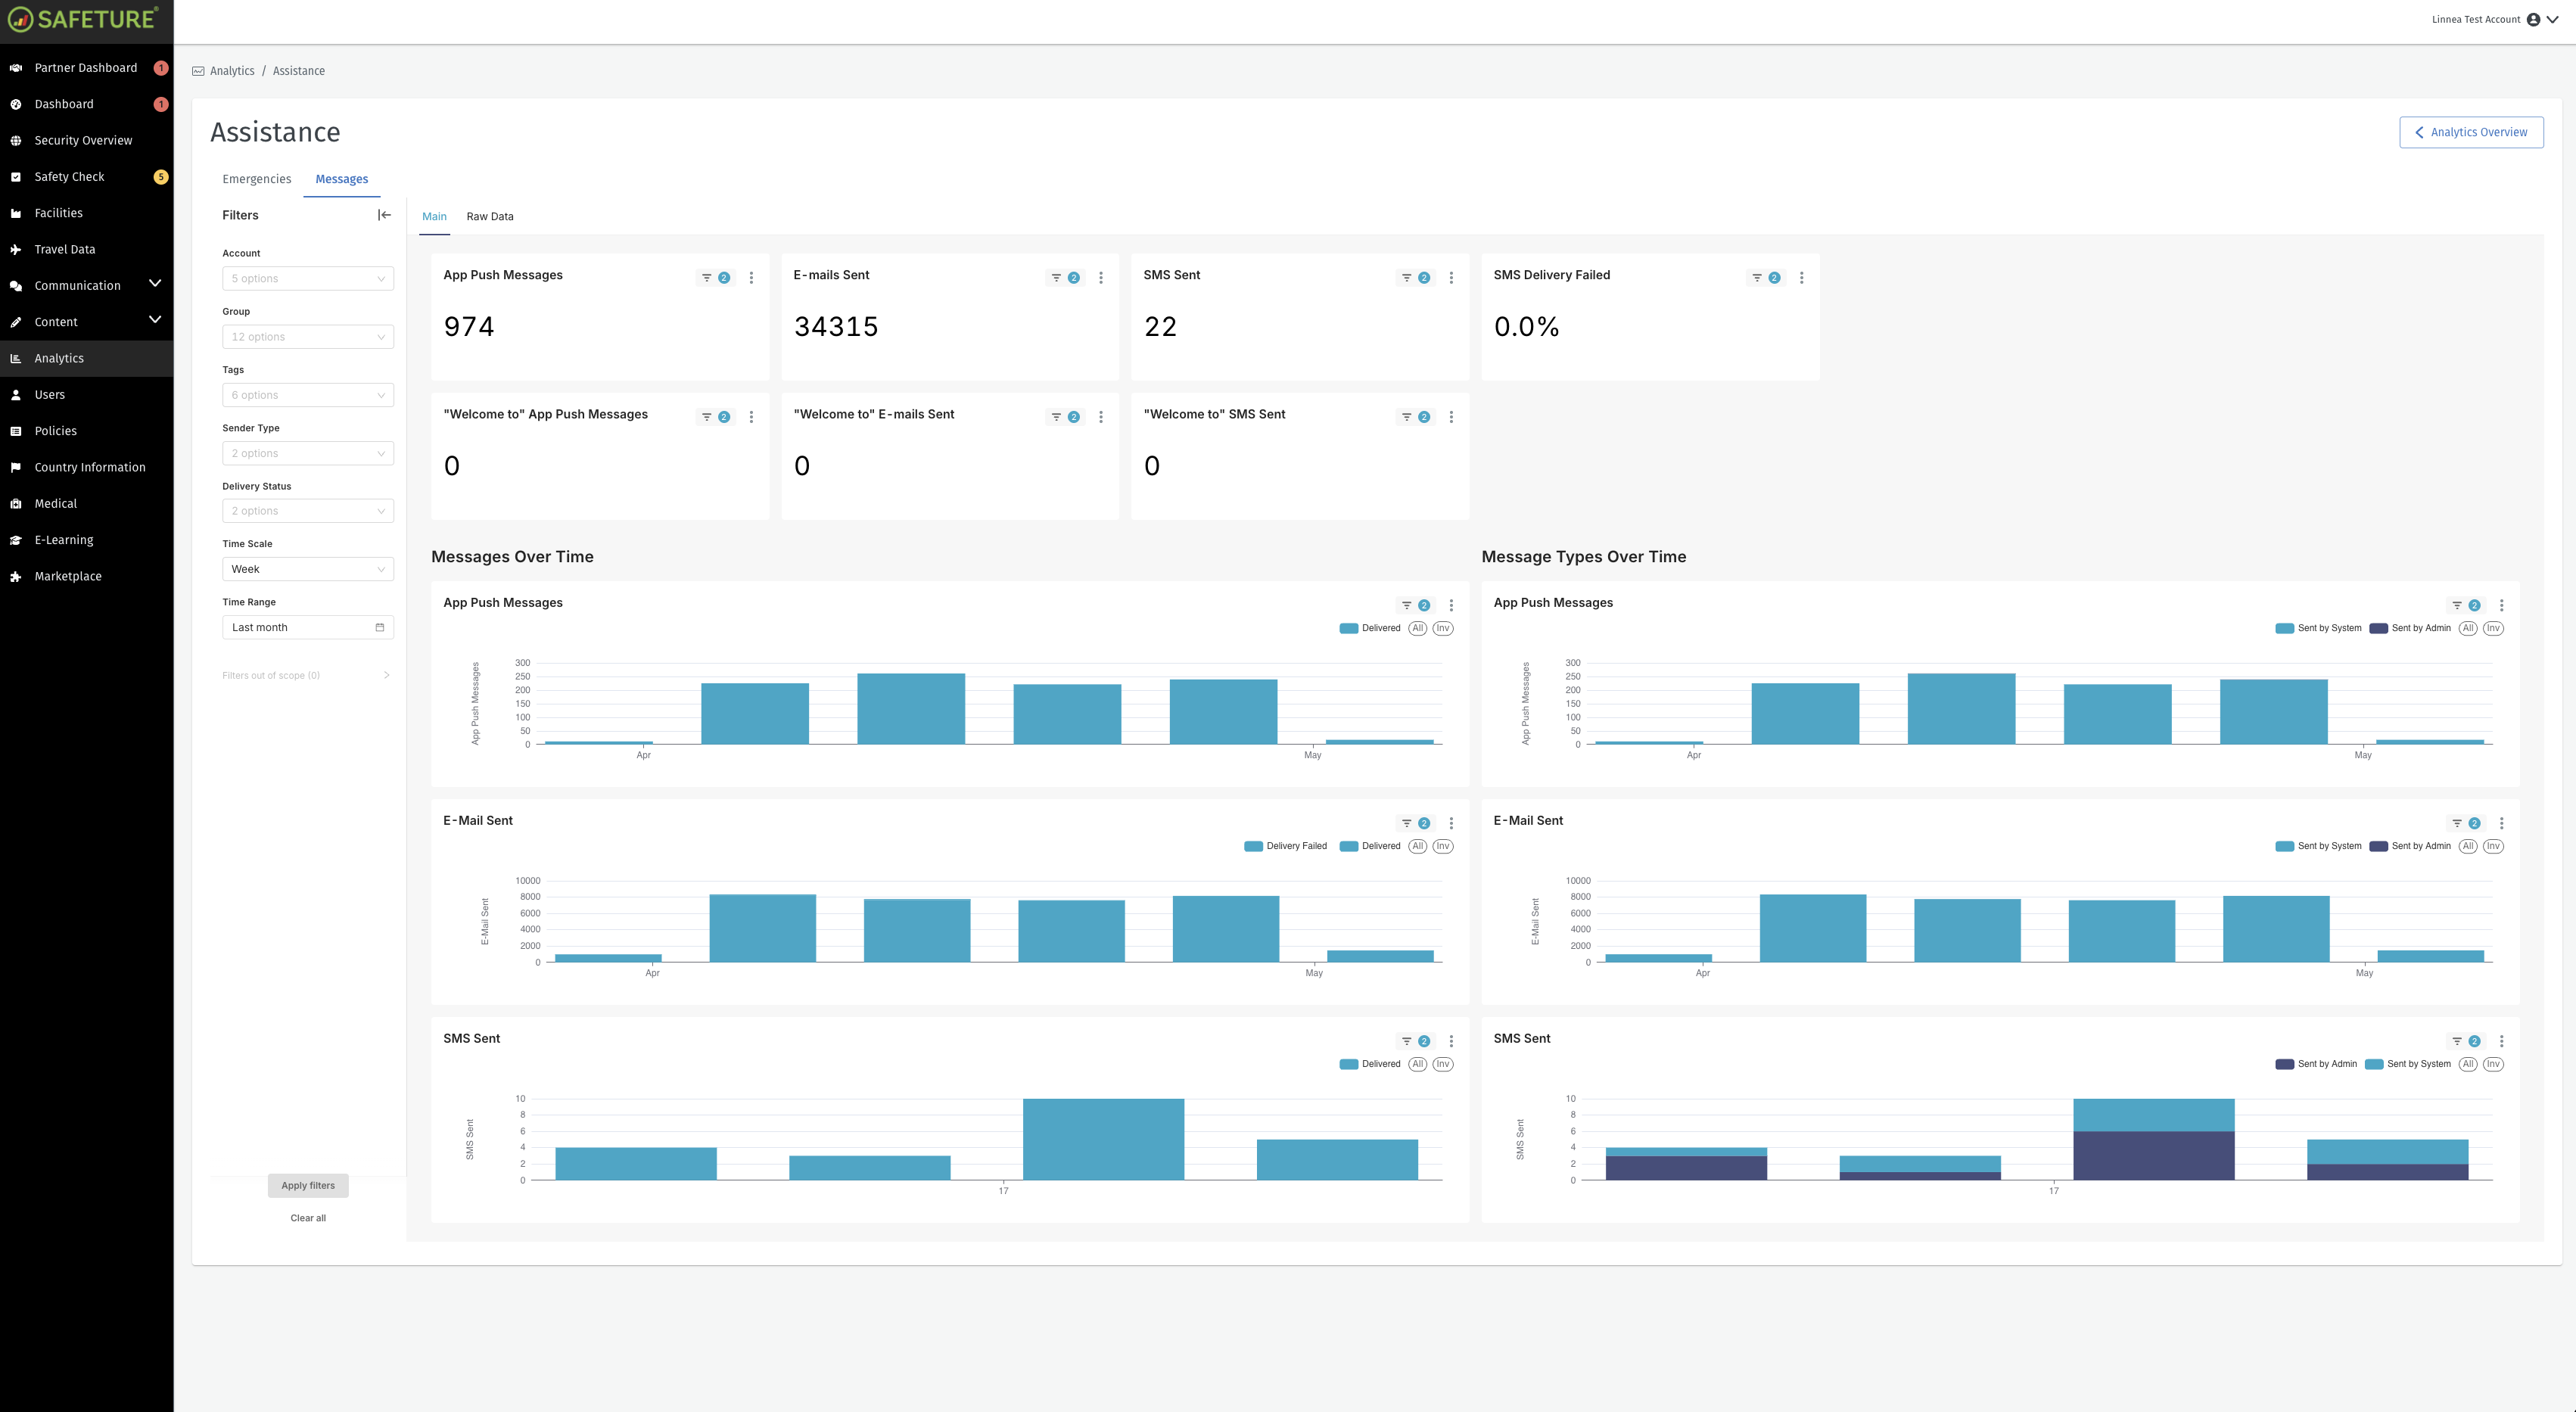
Communication Data in the Analytics Module