
Trips (PNRs) and time spent abroad
Last updated: May 5, 2026
Introduction to Travel Statistics
This section of the Analytics Module offers insights into your organisation’s travel patterns and the time users spend abroad. It includes the following tabs:
PNR Overview
Trip Details
Trip Statistics
Time Spent Abroad
PNR Overview
The PNR Overview tab provides data on the number of travel segments and their corresponding locations within your organization’s travel activity.
Filtering Options
You can customize the data in the PNR Overview tab using the following filters:
Account: Filters data by costumer account.
Group: Filters data by user group.
Tags: Filters data by user tags.
Risk Intelligence Supplier: Filters data by risk intelligence supplier.
Time Scale: Adjusts the “Segments Over Time” chart to display data on a daily, weekly, monthly, quarterly, or yearly basis.
Time Range: Specifies the time period you are viewing.
Arrival Continent: Filters data based on PNR arrival continent
Country Risk Level: Filters data based on country risk level.
Segment Type: Filters data by travel segment type.
Domestic/International: Filters data based on domestic/international trips
Status: Filters data based on canceled or actual bookings/departures.
KPIs
In the cards above the charts, you’ll find key performance indicators. The KPIs for the PNR Overview include:
Segments: The total number of travel segments (flights, cars, hotels, or trains).
Users Traveling: The number of unique users traveling within the selected period.
Group PNRs: The percentage of group PNRs (shared itineraries for multiple travelers).
CO2 (t): Estimated CO2 emissions from flights, measured in tonnes.
PNRs: The total number of unique Passenger Name Records (PNRs).
Users with App: The percentage of users utilizing the Safeture app.
Distance Traveled (km): The total number of distance traveled.
Charts
Segments Per Type: Pie chart showing the distribution of different travel segment types.
Segments Over Time: Displays two charts illustrating the number of bookings and departures across the selected time scale. Bars differentiate actual segments (blue) from canceled segments (orange).
Segments Per Destination: Provides a geographical overview of travel segments, helping you quickly identify the most popular destinations for your users.
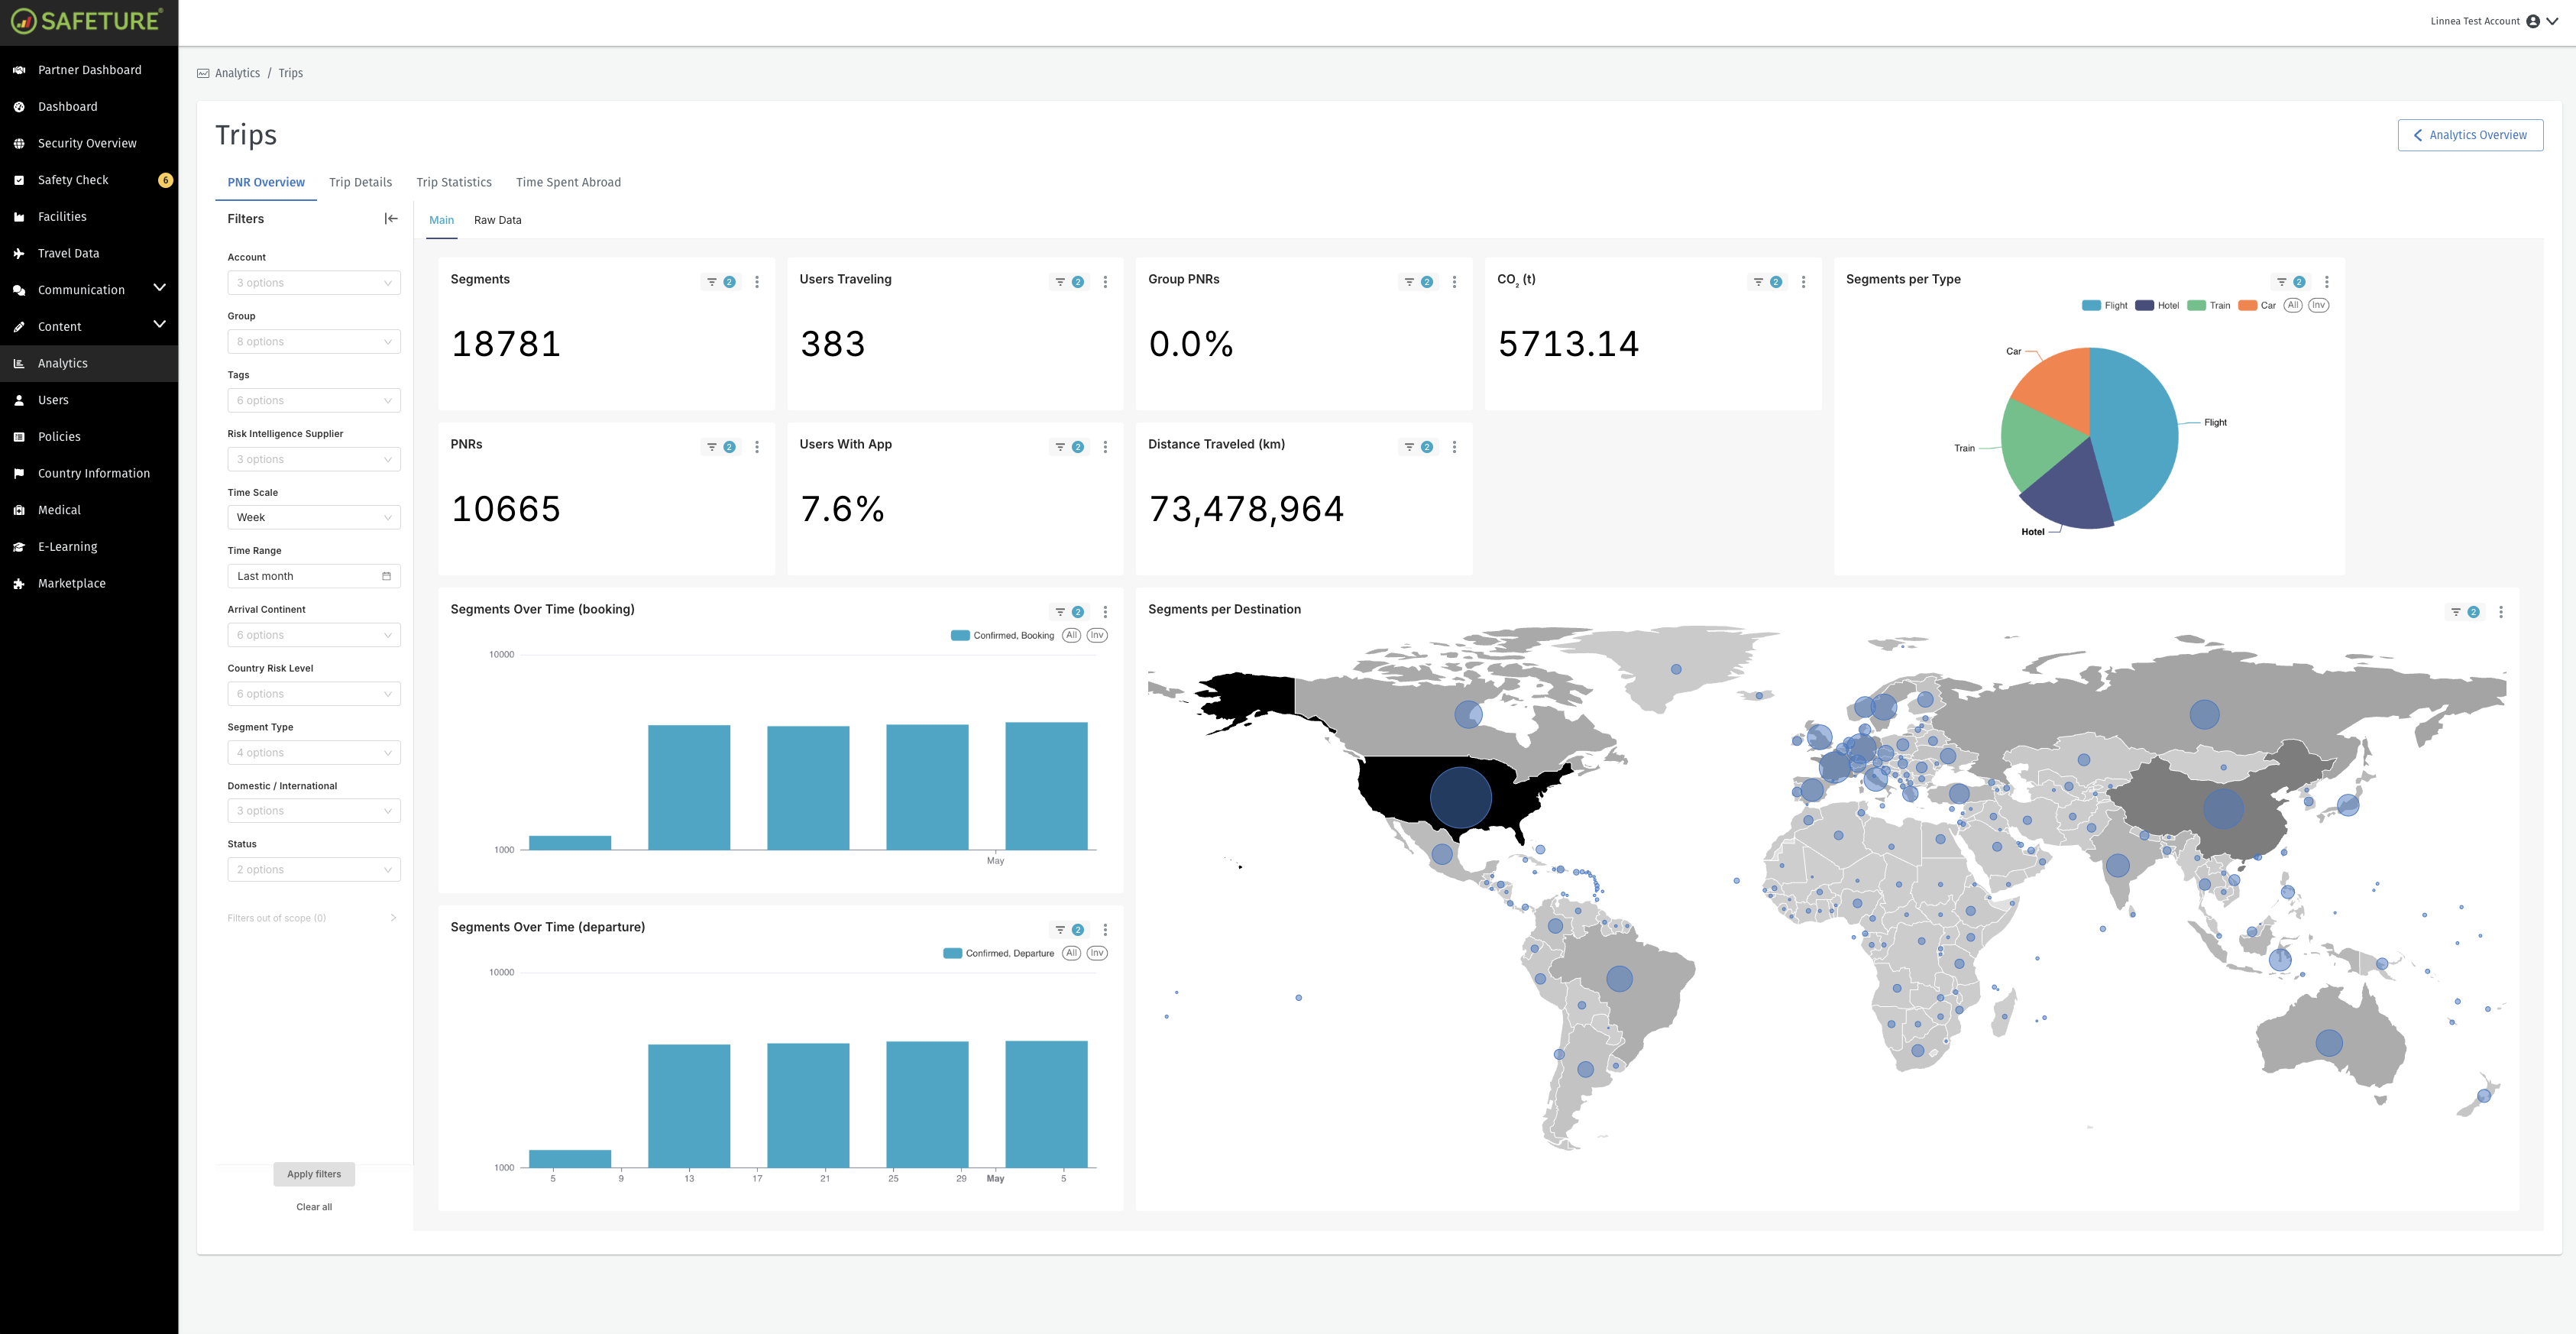
PNR Overview in the Analytics Module
Trip Details
The Trip Details tab offers a comprehensive view of all trips.
Filtering Options
The Trip Details tab includes the following filters:
Time Range: Specifies the time period you are viewing.
Account: Filters data by costumer account.
Group: Filters data by user group.
Tags: Filters data by user tags.
Risk Intelligence Supplier: Filters data by risk intelligence supplier.
Arrival Continent: Filters data based on PNR arrival continent
Country Risk Level: Filters data based on country risk level.
Segment Type: Filters data by travel segment type.
Domestic/International: Filters data based on domestic/international trips
Status: Filters data based on canceled or actual bookings/departures.
Travel Details Sheet
The travel details sheet includes columns for each travel segment, providing key information such as:
Departure Date
Departure Country
Arrival Country
Arrival Date
Segment Type
Country Risk at Destination
Travelers
Distance Travelled
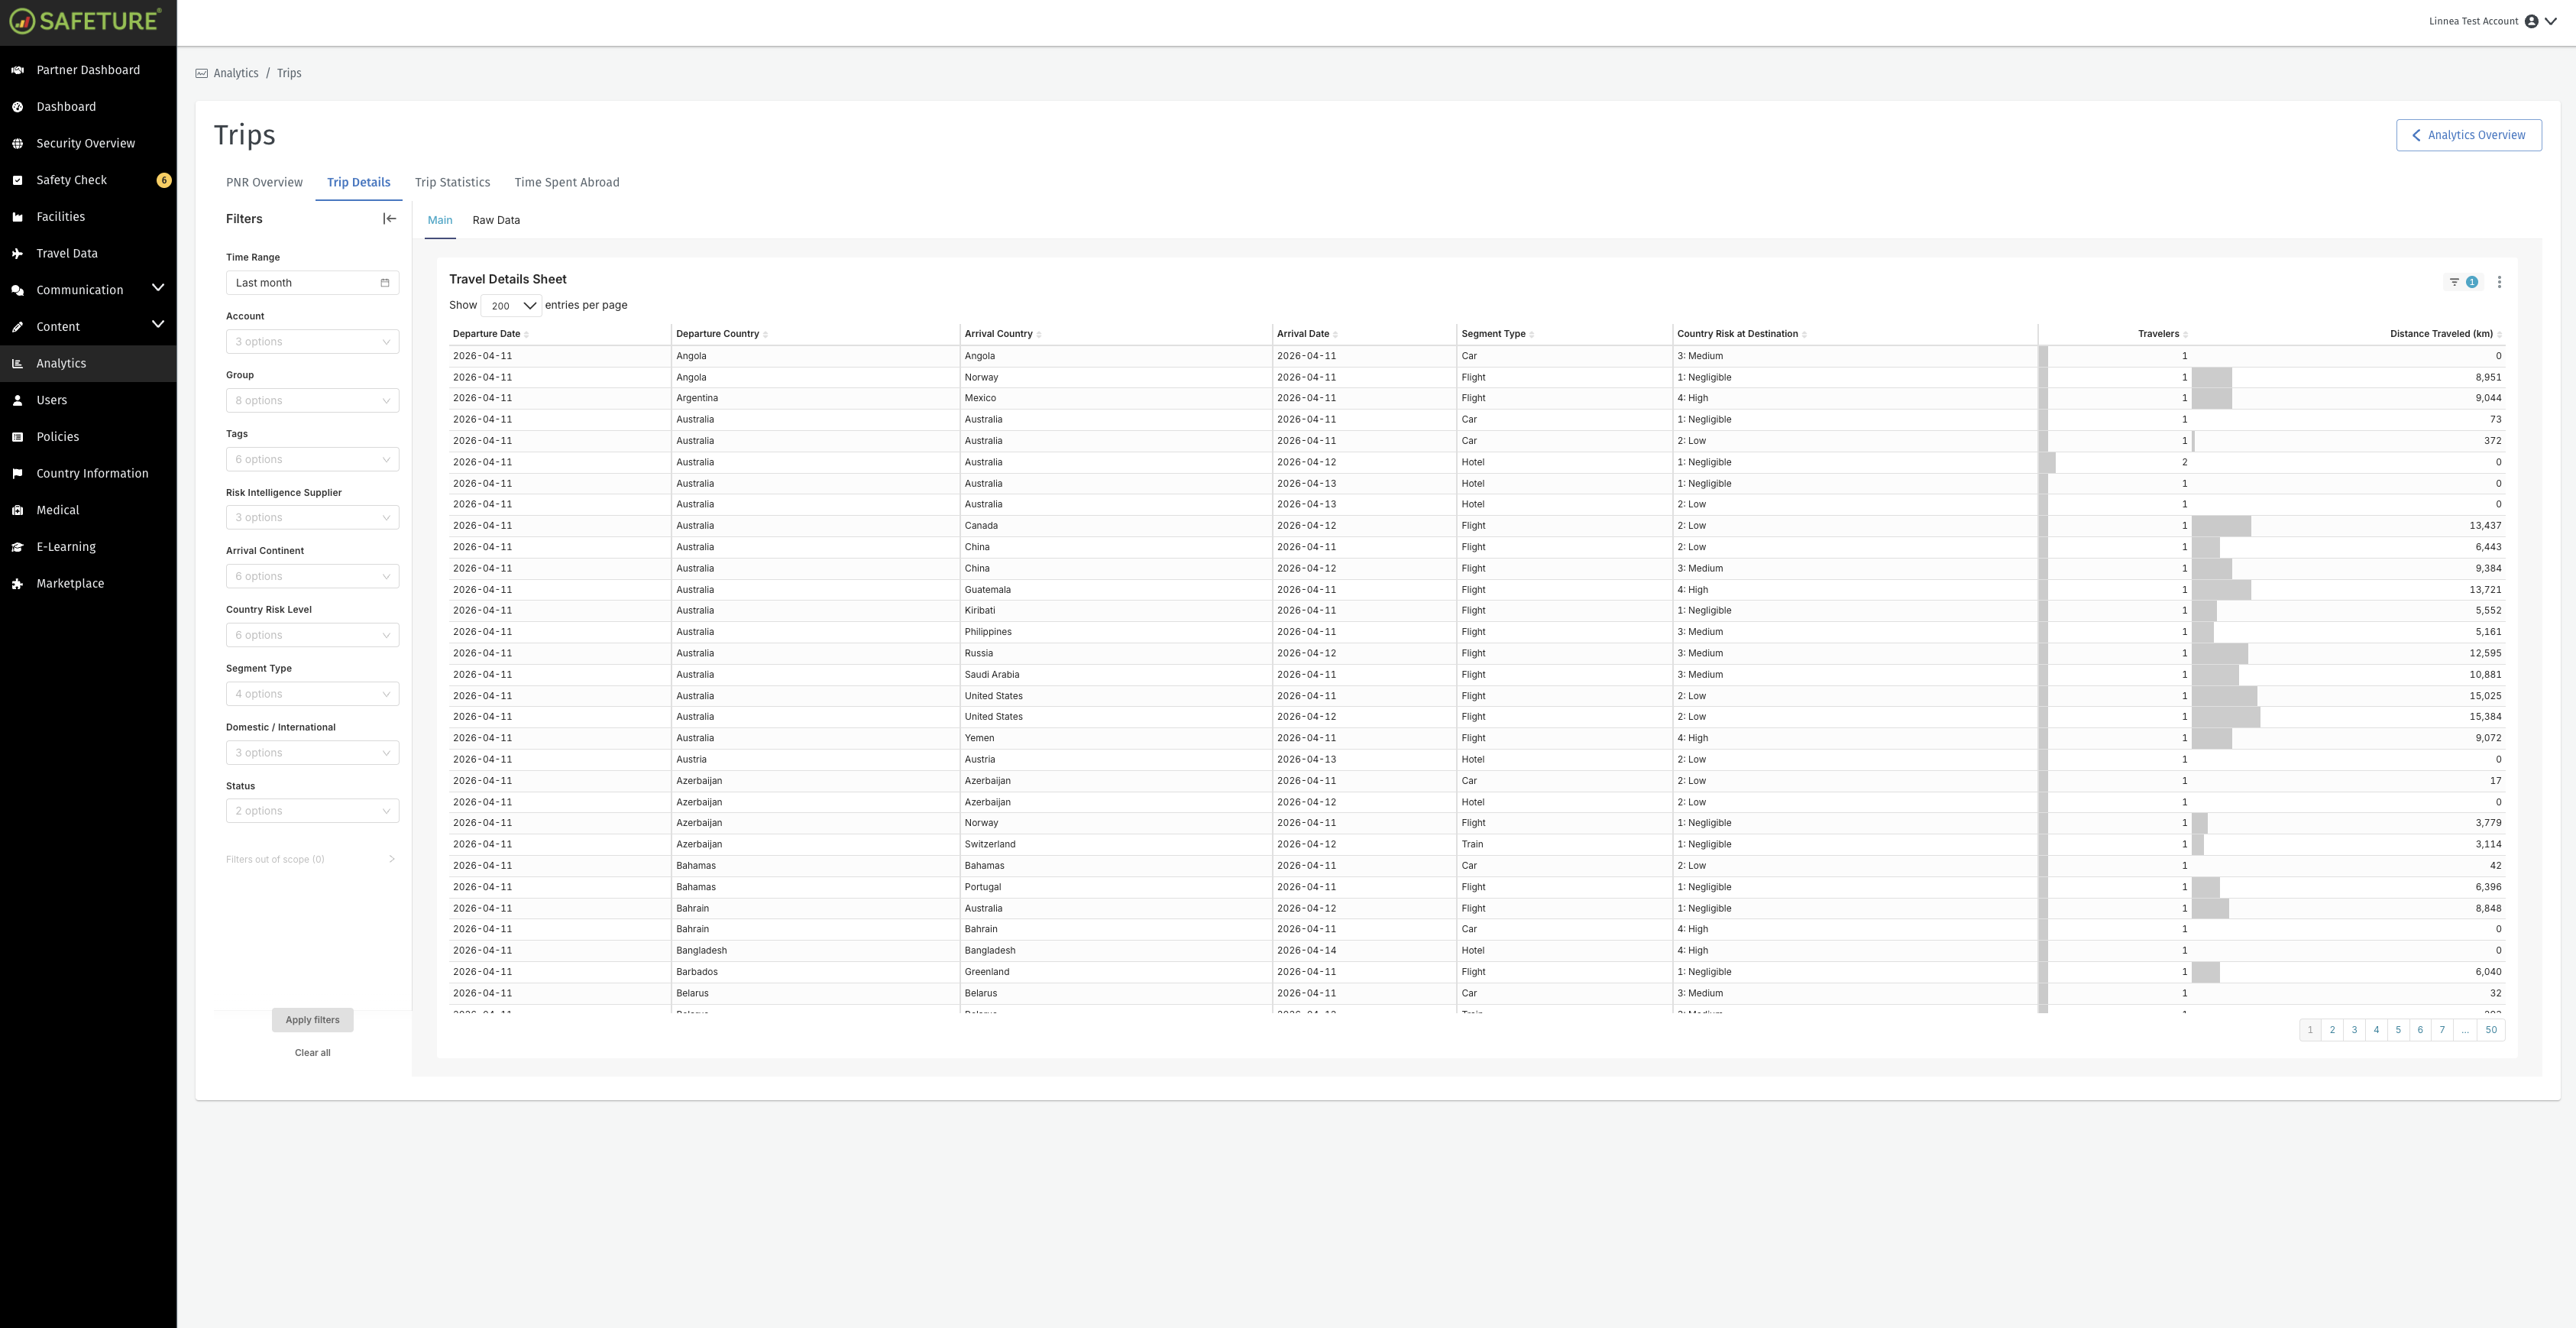
Trip Details in the Analytics Module
Trip Statistics
Filtering Options
The filtering menus in the Trip Statistics tab allow you to customize the display of data based on the following parameters:
Account: Filters data by costumer account.
Group: Filters data by user group.
Tags: Filters data by user tags.
Risk Intelligence Supplier: Filters data by risk intelligence supplier.
Departure Country: Filters data by departure country
Arrival Country: Filters data by arrival country
Arrival Continent: Filters data by arrival continent
Status: Filters data by PNR status (Confirmed or Cancelled)
Segment Type: Filters data by segment type (car, flight, hotel or train)
Domestic or International: Filters data by domestic or international PNRs
Country Risk At Destination: Filters data by destination’s country risk level
KPIs
To the right of the filtering options, you'll find key performance indicators (KPIs). Hover over each KPI to see its definition. The Travel Statistics tab displays the following KPIs:
Average Days Per Trip: Average trip duration in days based on departure and return times per travel booking. Note that this is calculated based on the first and last timestamps within a PNR
Segments
Graphs
The Travel Statistics tab features three distinct graphs:
Country Destinations (Segments): Displays the number of segments to that specific country. The color of the bar indicates the country risk level.
City Destinations (Segments): Displays the number of travel segments to that specific city. The color of the bar indicates the city risk level.
Average Days Per Trip (PNRs): Average number of days per PNR
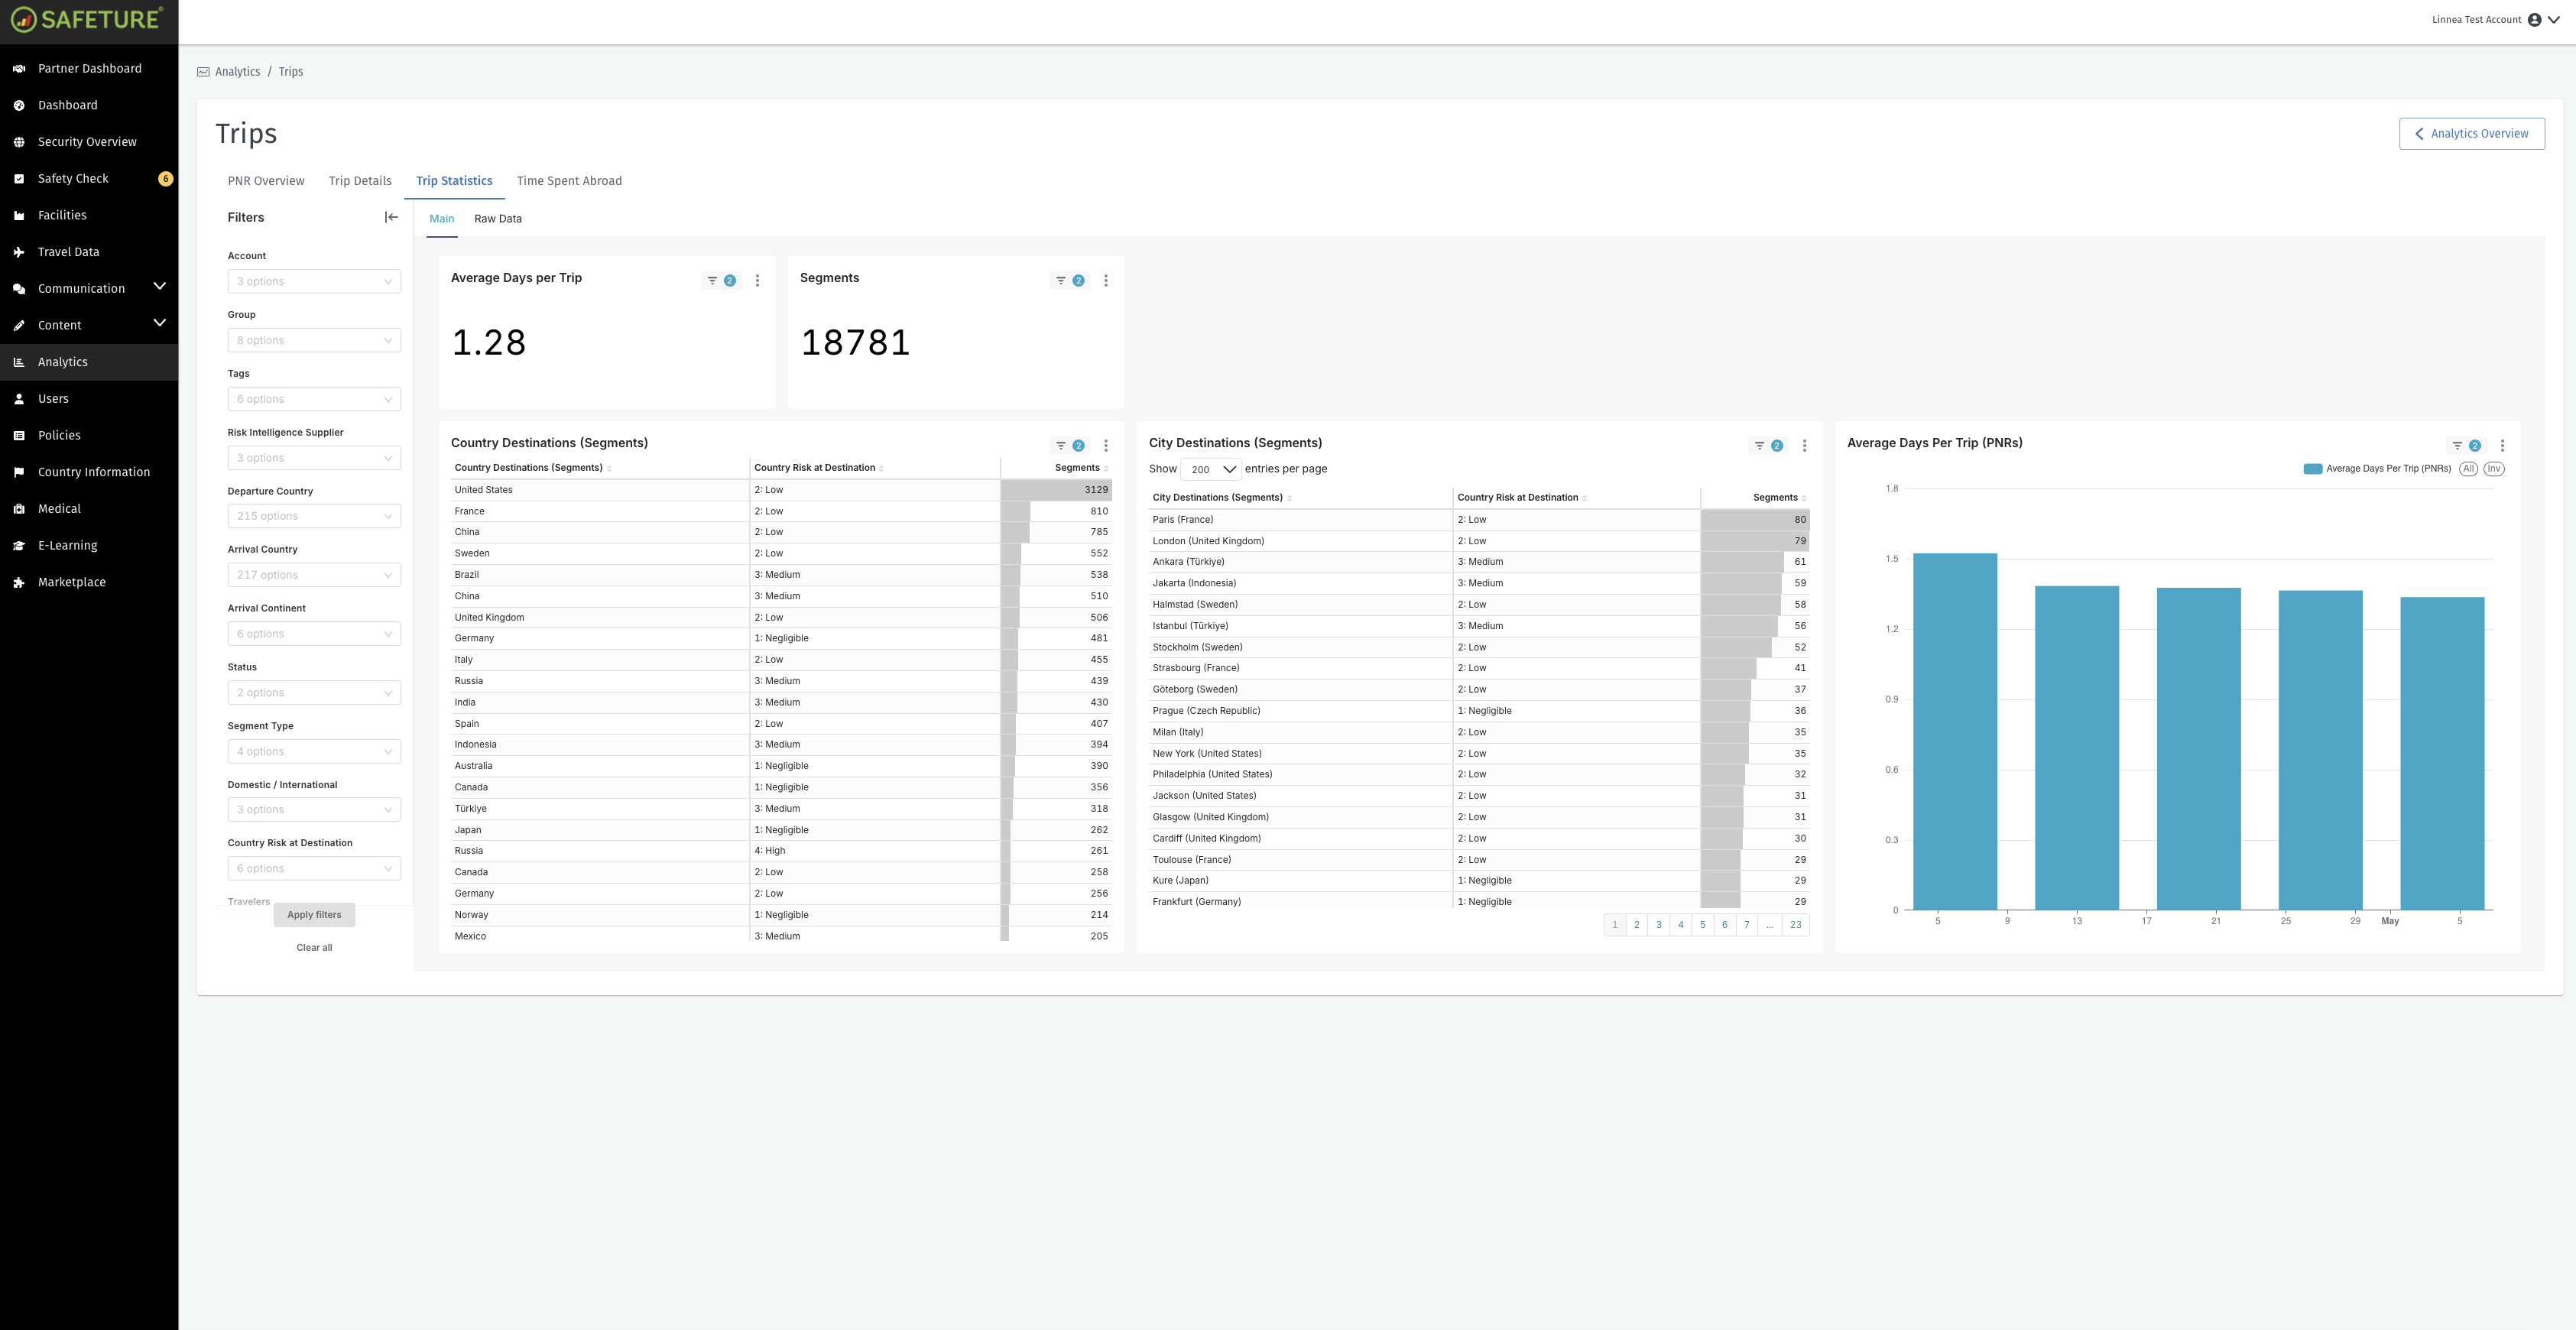
Trip Statistics in the Analytics Module
Time Spent Abroad
The Time Spent Abroad tab offers insights into where and how much time your organization spends traveling internationally. The data is sourced from both app location history and travel bookings.
KPIs
Key performance indicators in this tab include:
Countries: The total number of countries visited by users during the selected time period.
Time Spent Abroad (days): The total duration spent outside the home region.
Travelers: The total number of traveling users during the selected time period.
Segments: The total number of travel segments during the selected time period.
Charts
Region/Province: Table showing the geographic distribution of travel activity across countries and regions.
Time spent abroad over time: A trend graph illustrating how much time your organization has spent abroad over a selected period. The chart also includes a forecast of expected travel time for the next six months, based on current travel patterns.
Countries map: A geographical map highlighting where users have spent the most time. Darker colors indicate greater time spent.
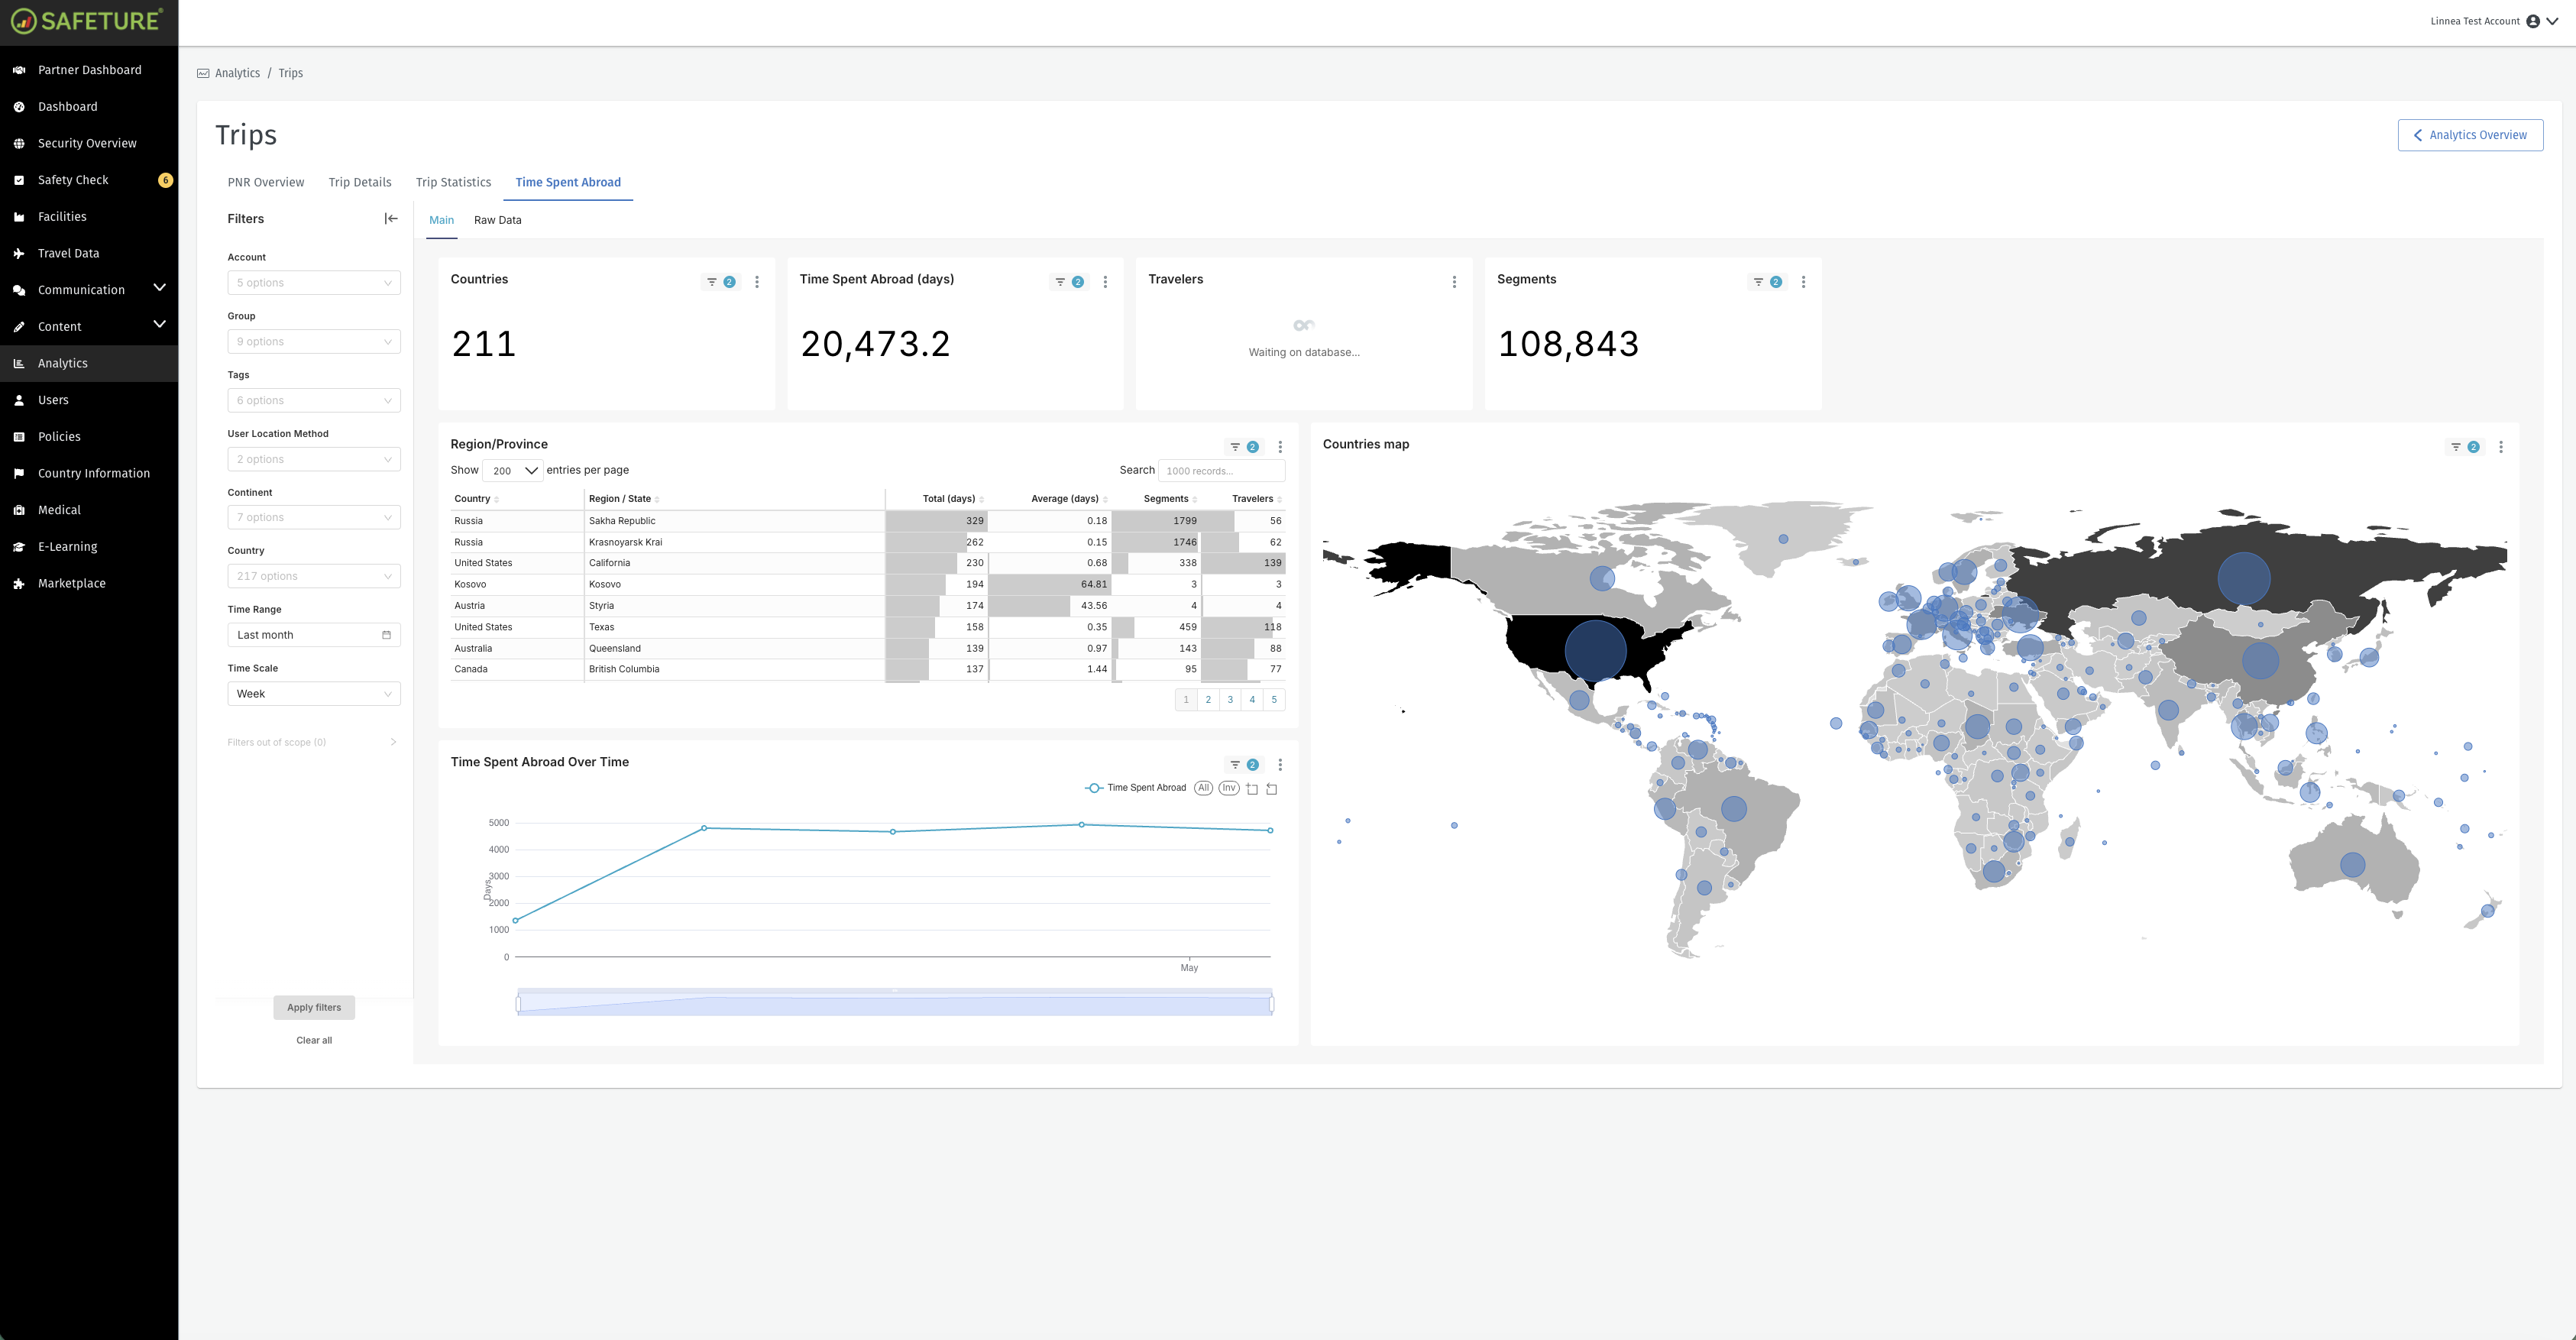
Overview of time spent abroad in the Analytics Module