Web portal and app usage, installations, and location settings
Last updated: May 5, 2026
Introduction to Usage
The Usage category within the Analytics Module provides detailed insights into how users interact with both the Safeture Mobile Application and Web Portal.
The Usage category is divided into the following tabs:
App Usage
App Installations
User App Devices
Current Users with App
Admin Sessions
App Usage
This tab offers data on which app content is most relevant to users and overall usage of the Safeture Mobile Application.
Filtering Options
The Travel Details tab includes the following filters:
Account: Filters data by account
Groups: Filters data by group
Tags: Filters data by tags
Time range: Specifies the time period you are viewing.
Time scale: Specifies how data is displayed in the timeline charts. You can choose to view data daily, weekly or monthly.
Country: Filters data by country.
Key Performance Indicators (KPIs):
Sessions: The total number of sessions initiated. A session is a series of actions taken while logged in, ending if the user is inactive for more than 10 minutes.
Actions: Total interactions within the app (e.g., clicks, reading alerts).
Actions per Session: Average actions taken during each session.
Average Session Duration (sec): The average time spent in the app during a session.
Users: Number of unique users interacting with the app within the selected time frame.
I’m OKs: Number of times users marked themselves as safe for an alert.
Read Alerts: Number of times alerts have been read.
Manually Reported Locations: Instances where users manually checked in.
Charts:
Average sessions per day: Shows average sessions per day.
Sessions over time: Shows average sessions over time.
Average unique users per day: Shows average unique users per weekday.
Users per session over time:
Clicks per Type: Displays which app content categories receive the most clicks.
Users with app activity over time:
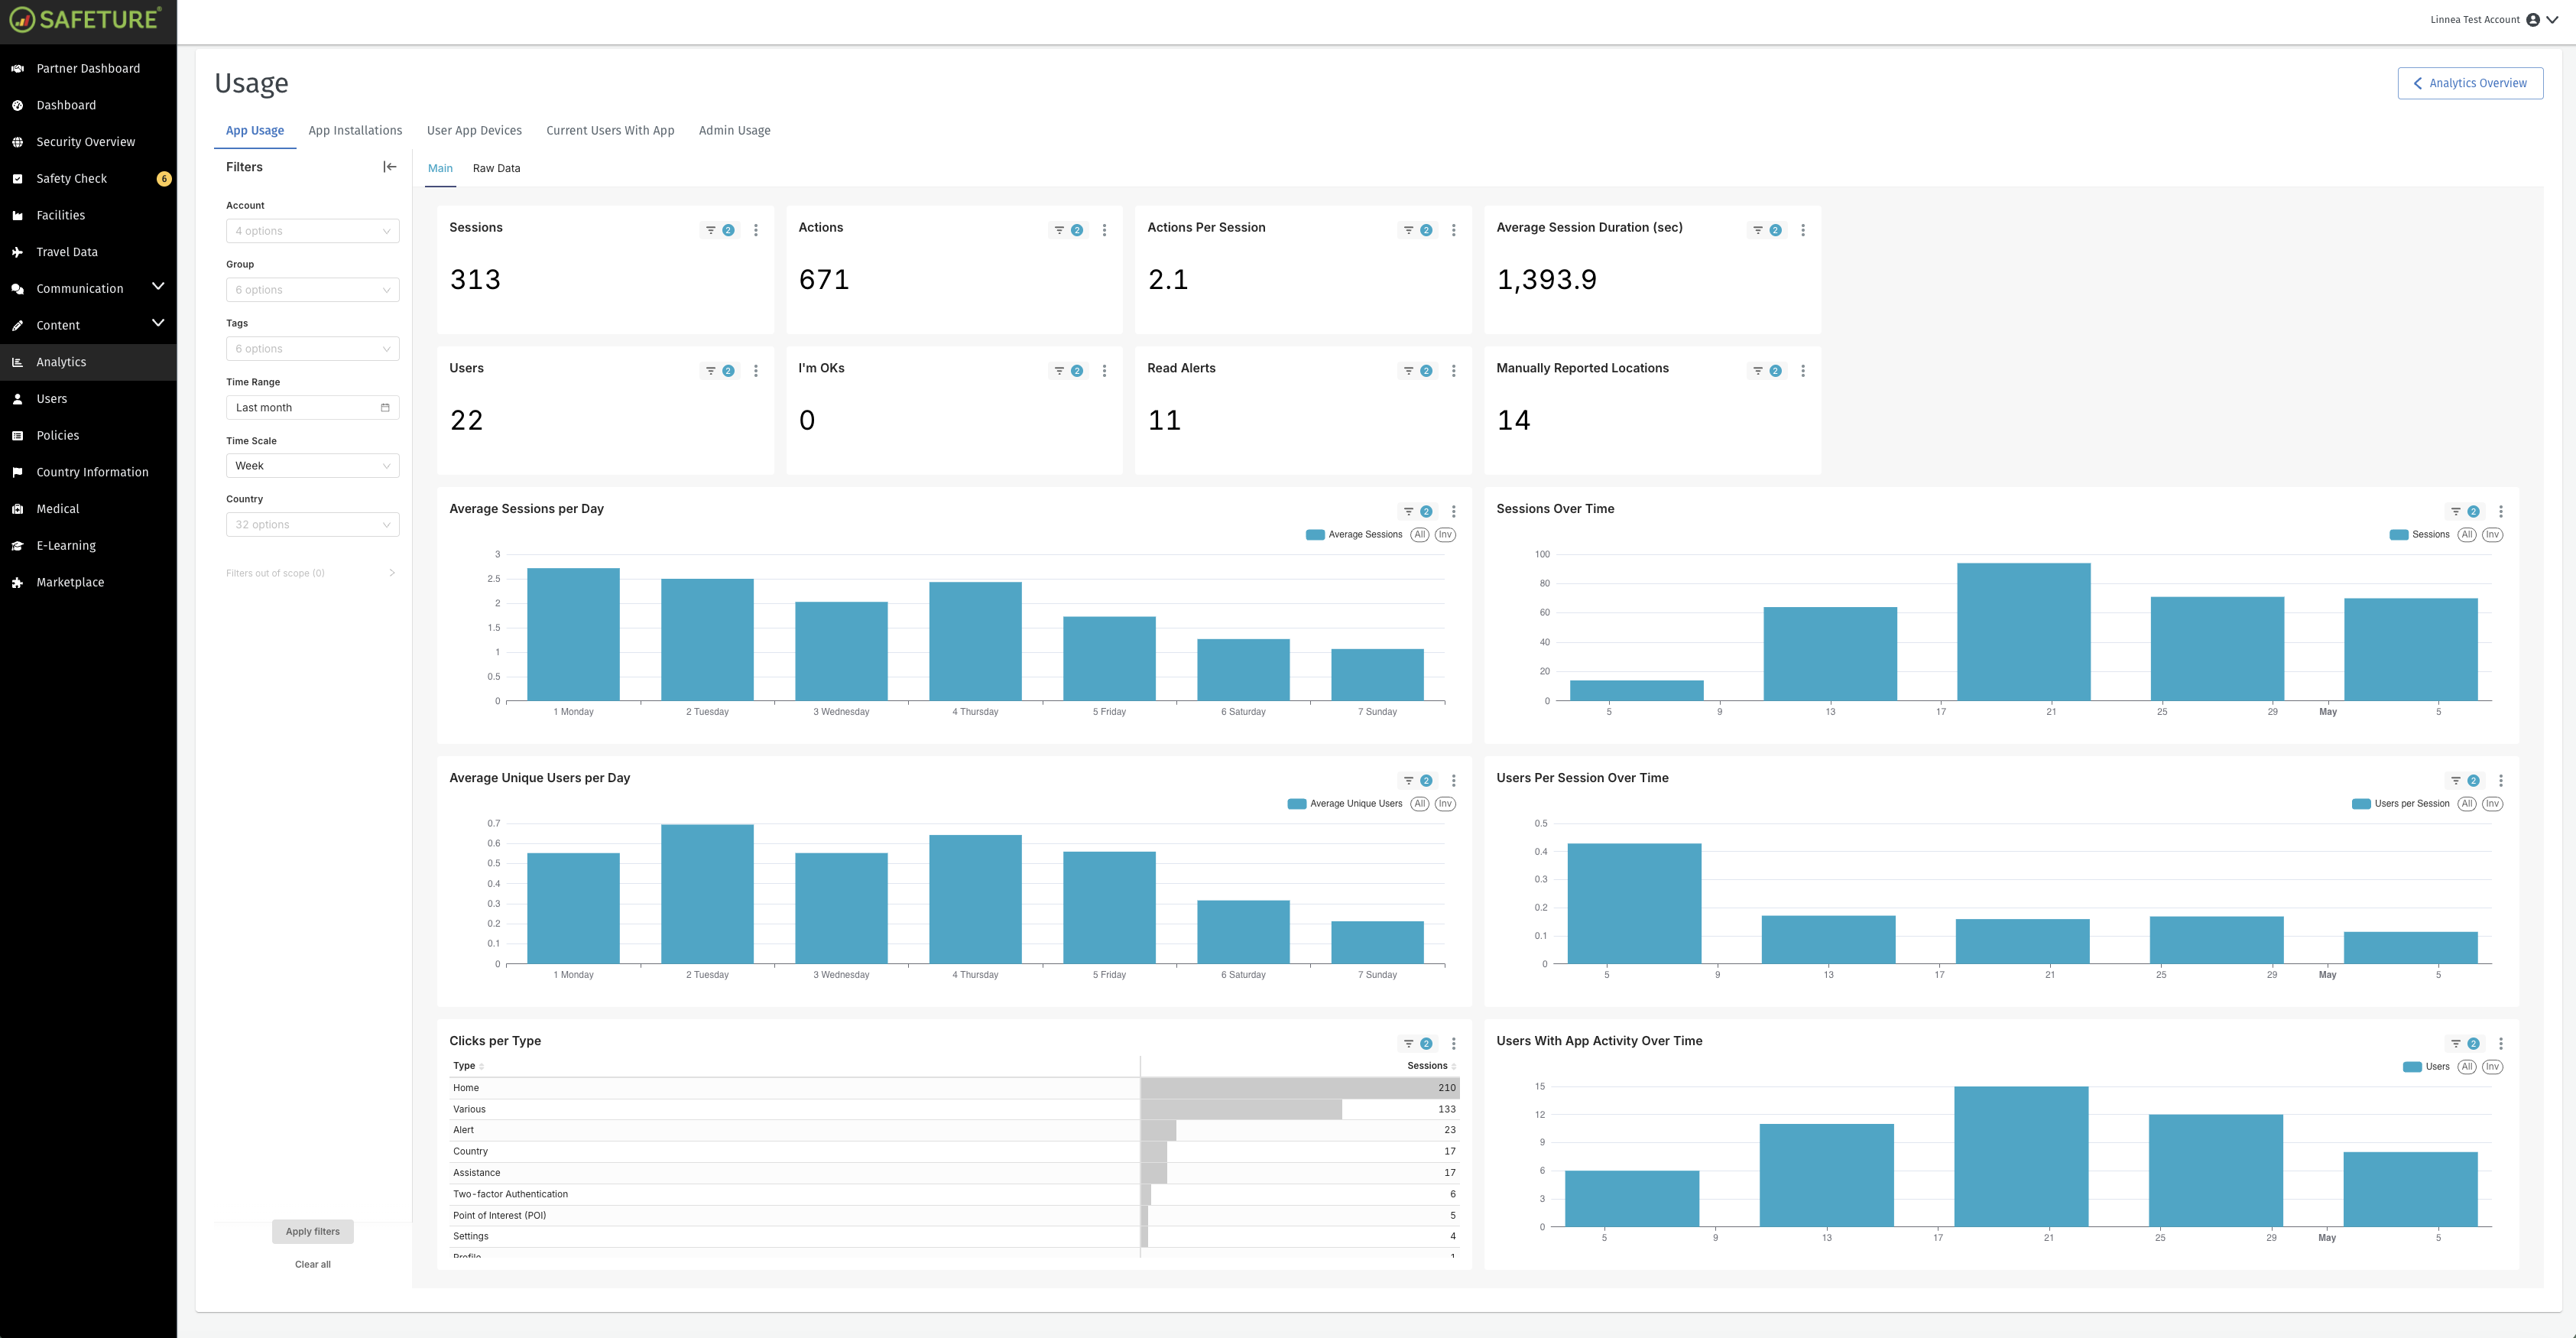
App usage data in the Analytics Module
App Installations
This tab highlights the number of Safeture app installations, helping you track adoption and take action to increase activation rates.
KPI:
Users with Installed App: Number of users who have installed and activated the Safeture app.
Charts:
Installation History: Displays installation trends, deletions, and net installations over time.
Installations by Country: A geographical map view of installation rates across different countries.
Number of Apps: Tracks the total number of active Safeture apps, with a breakdown by month.
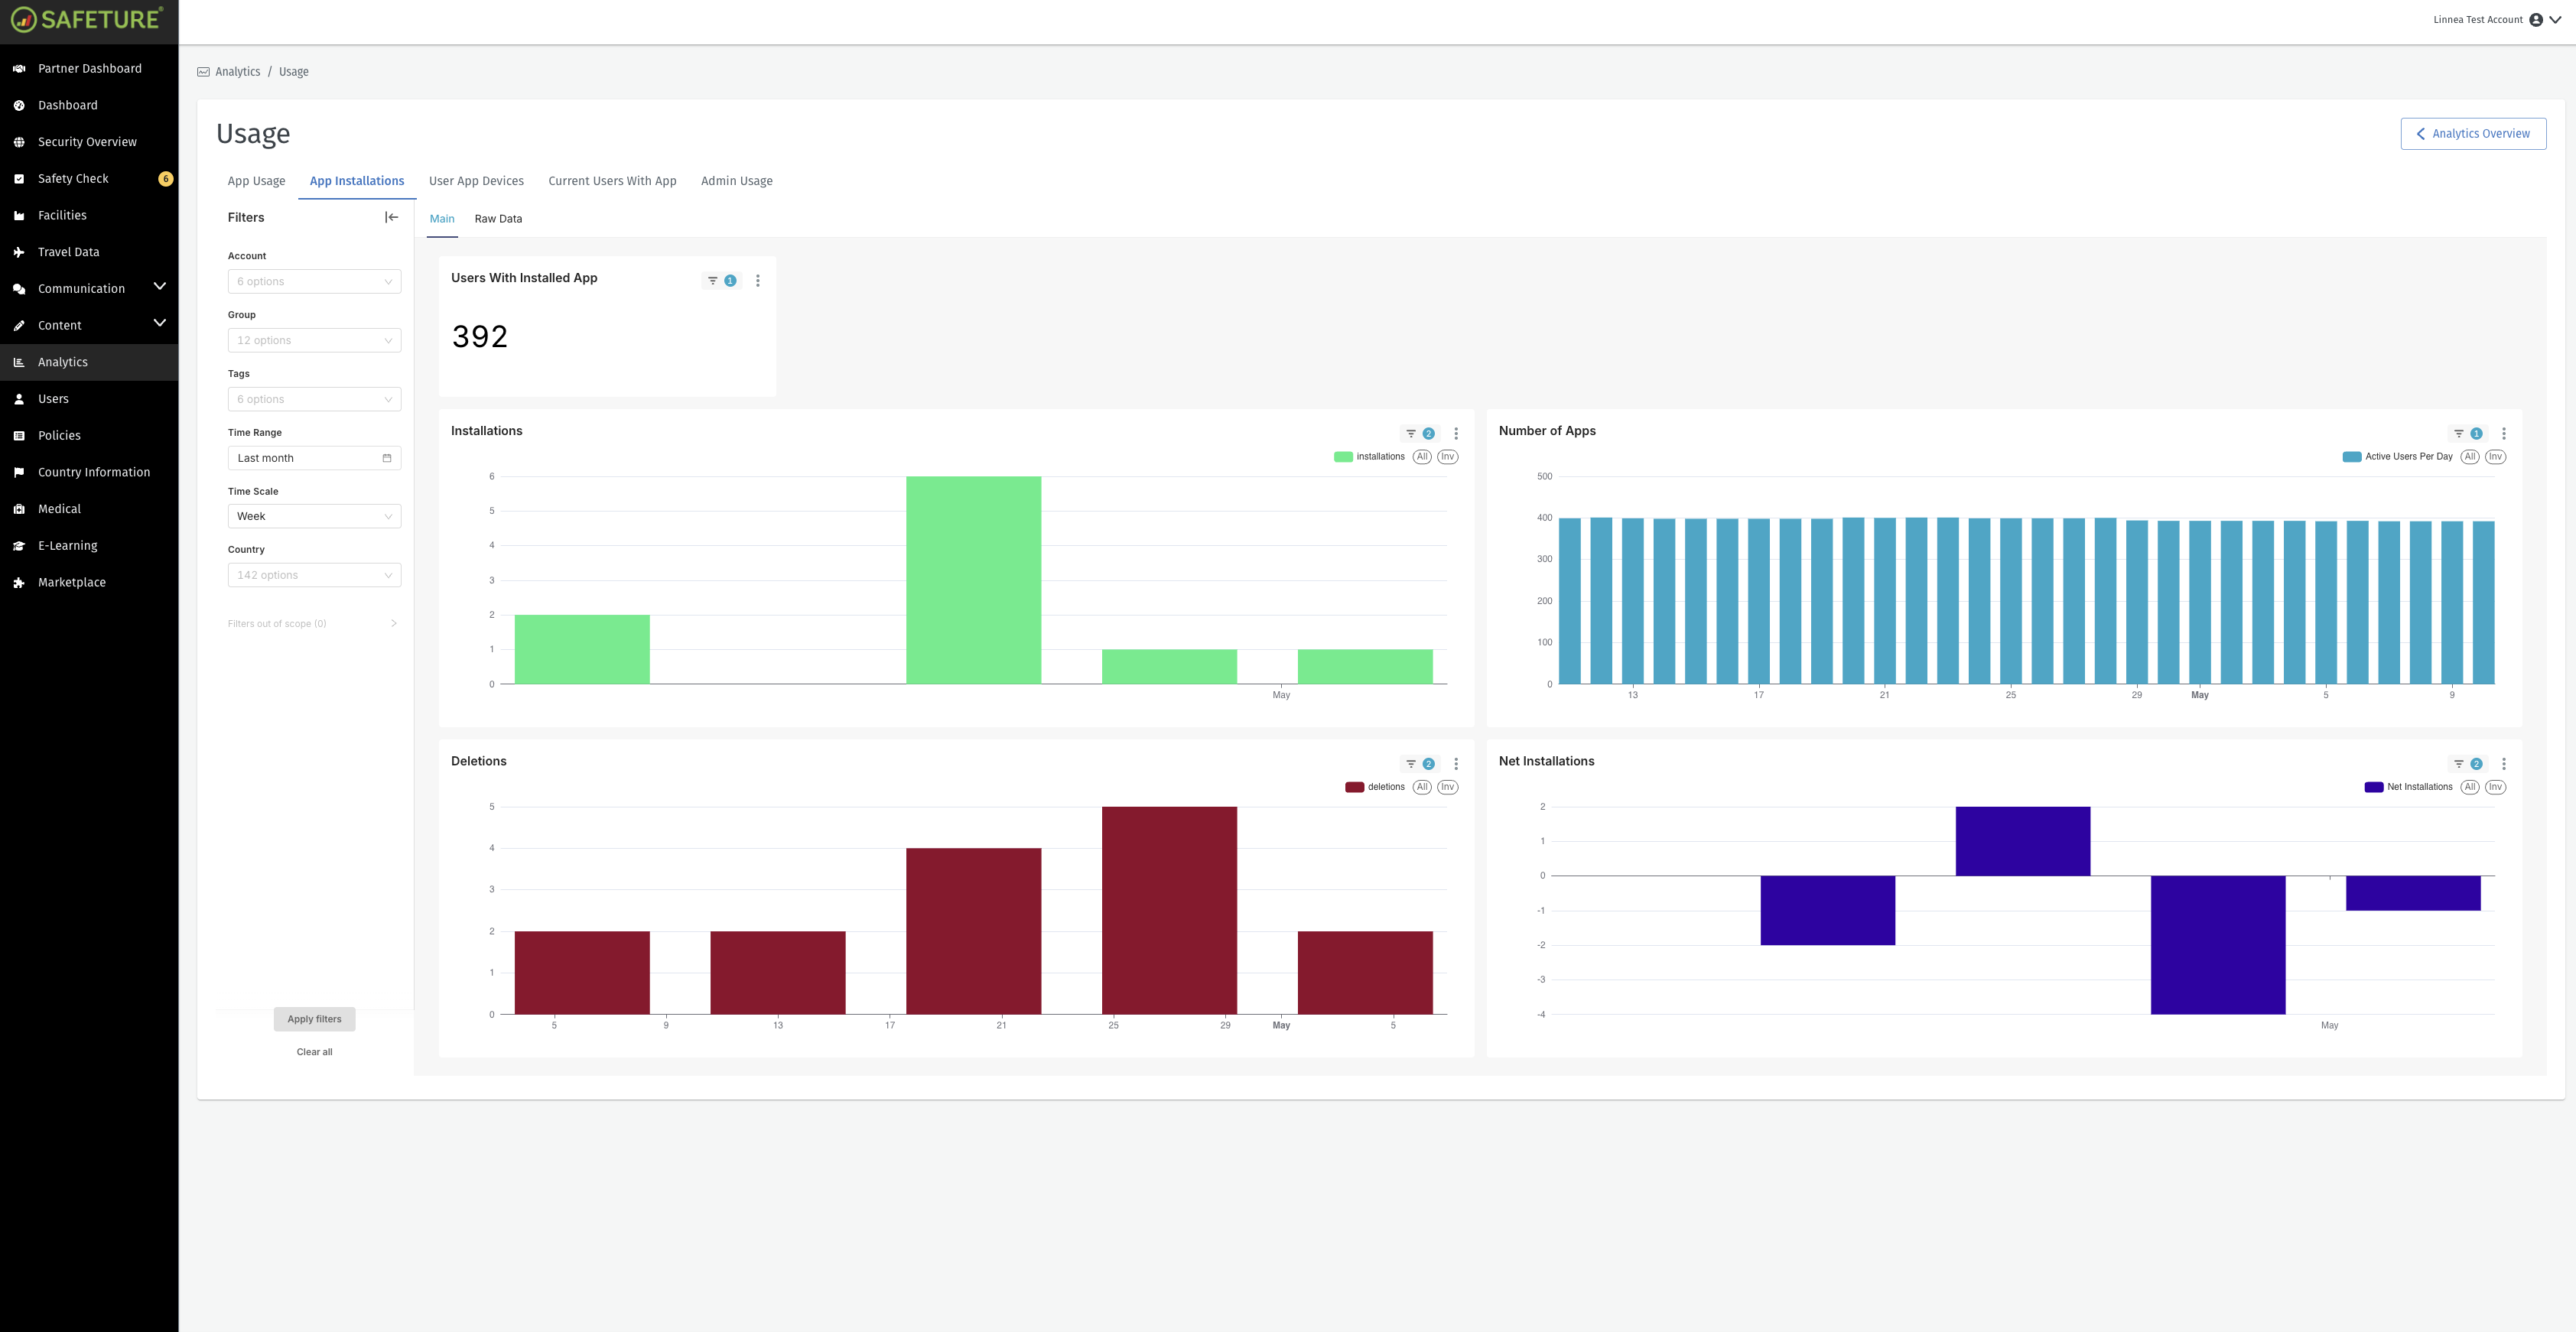
App installations data in the Analytics Module
User App Devices
This tab displays the distribution of device types across different countries. You can filter the view to focus on either active or inactive users. It also shows the breakdown of users by Android vs. iPhone.
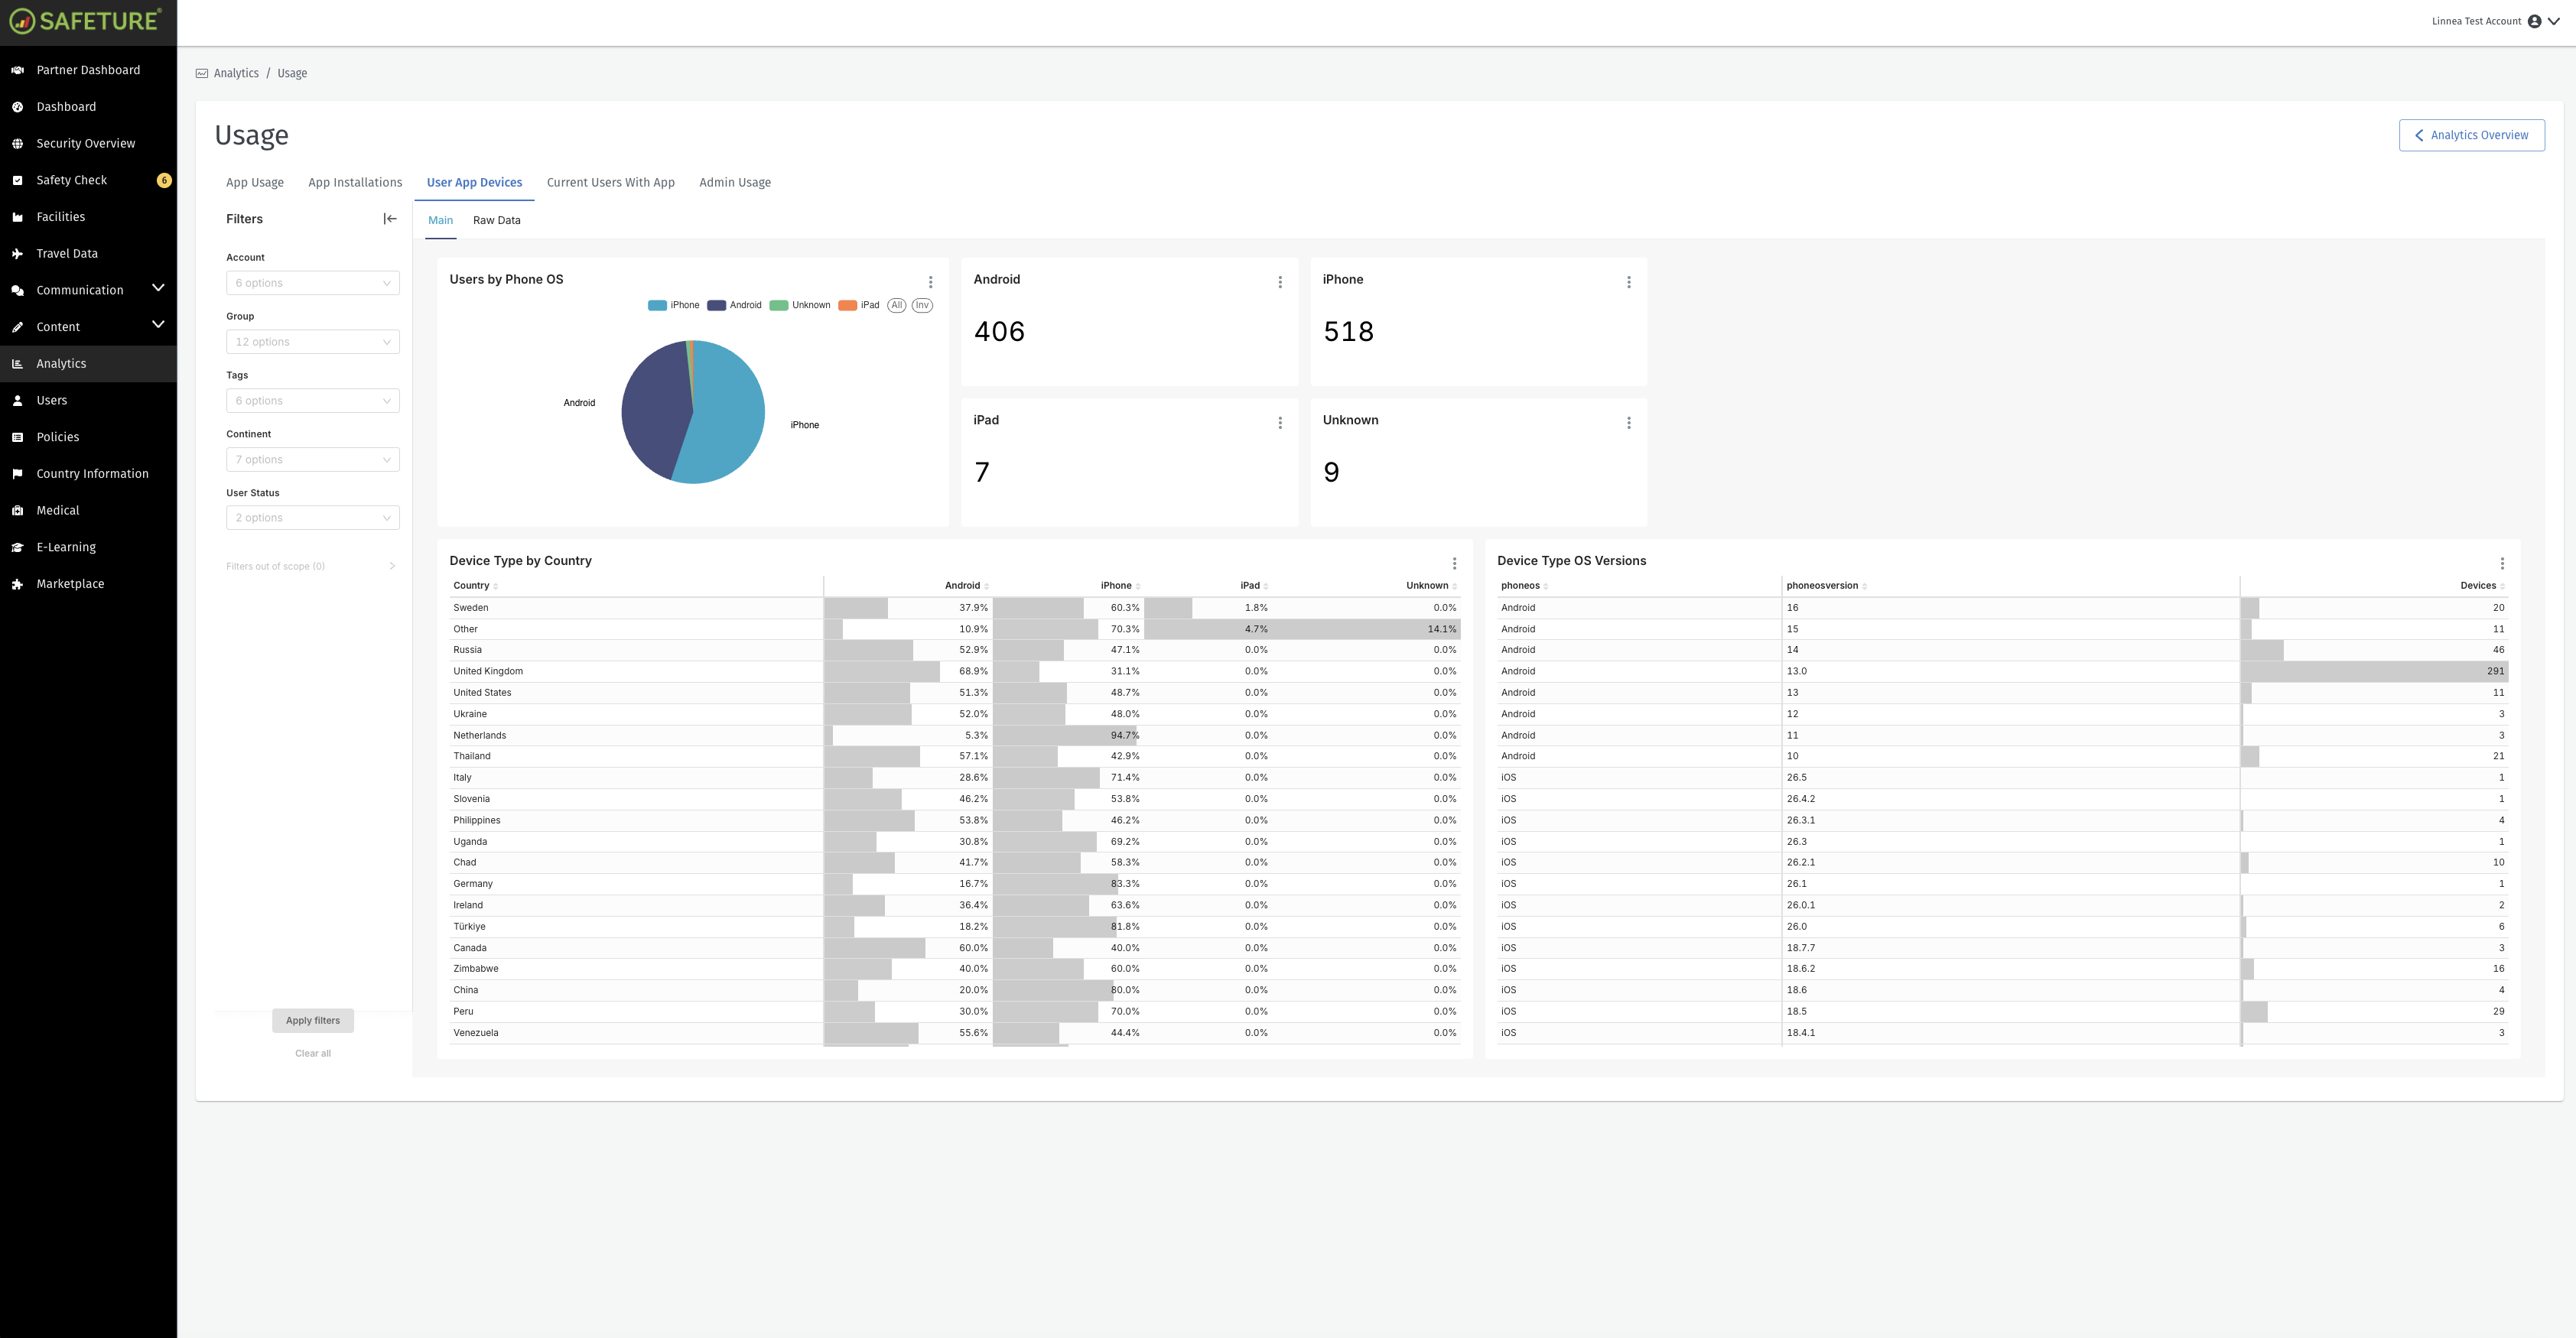
Device data in the Analytics Module
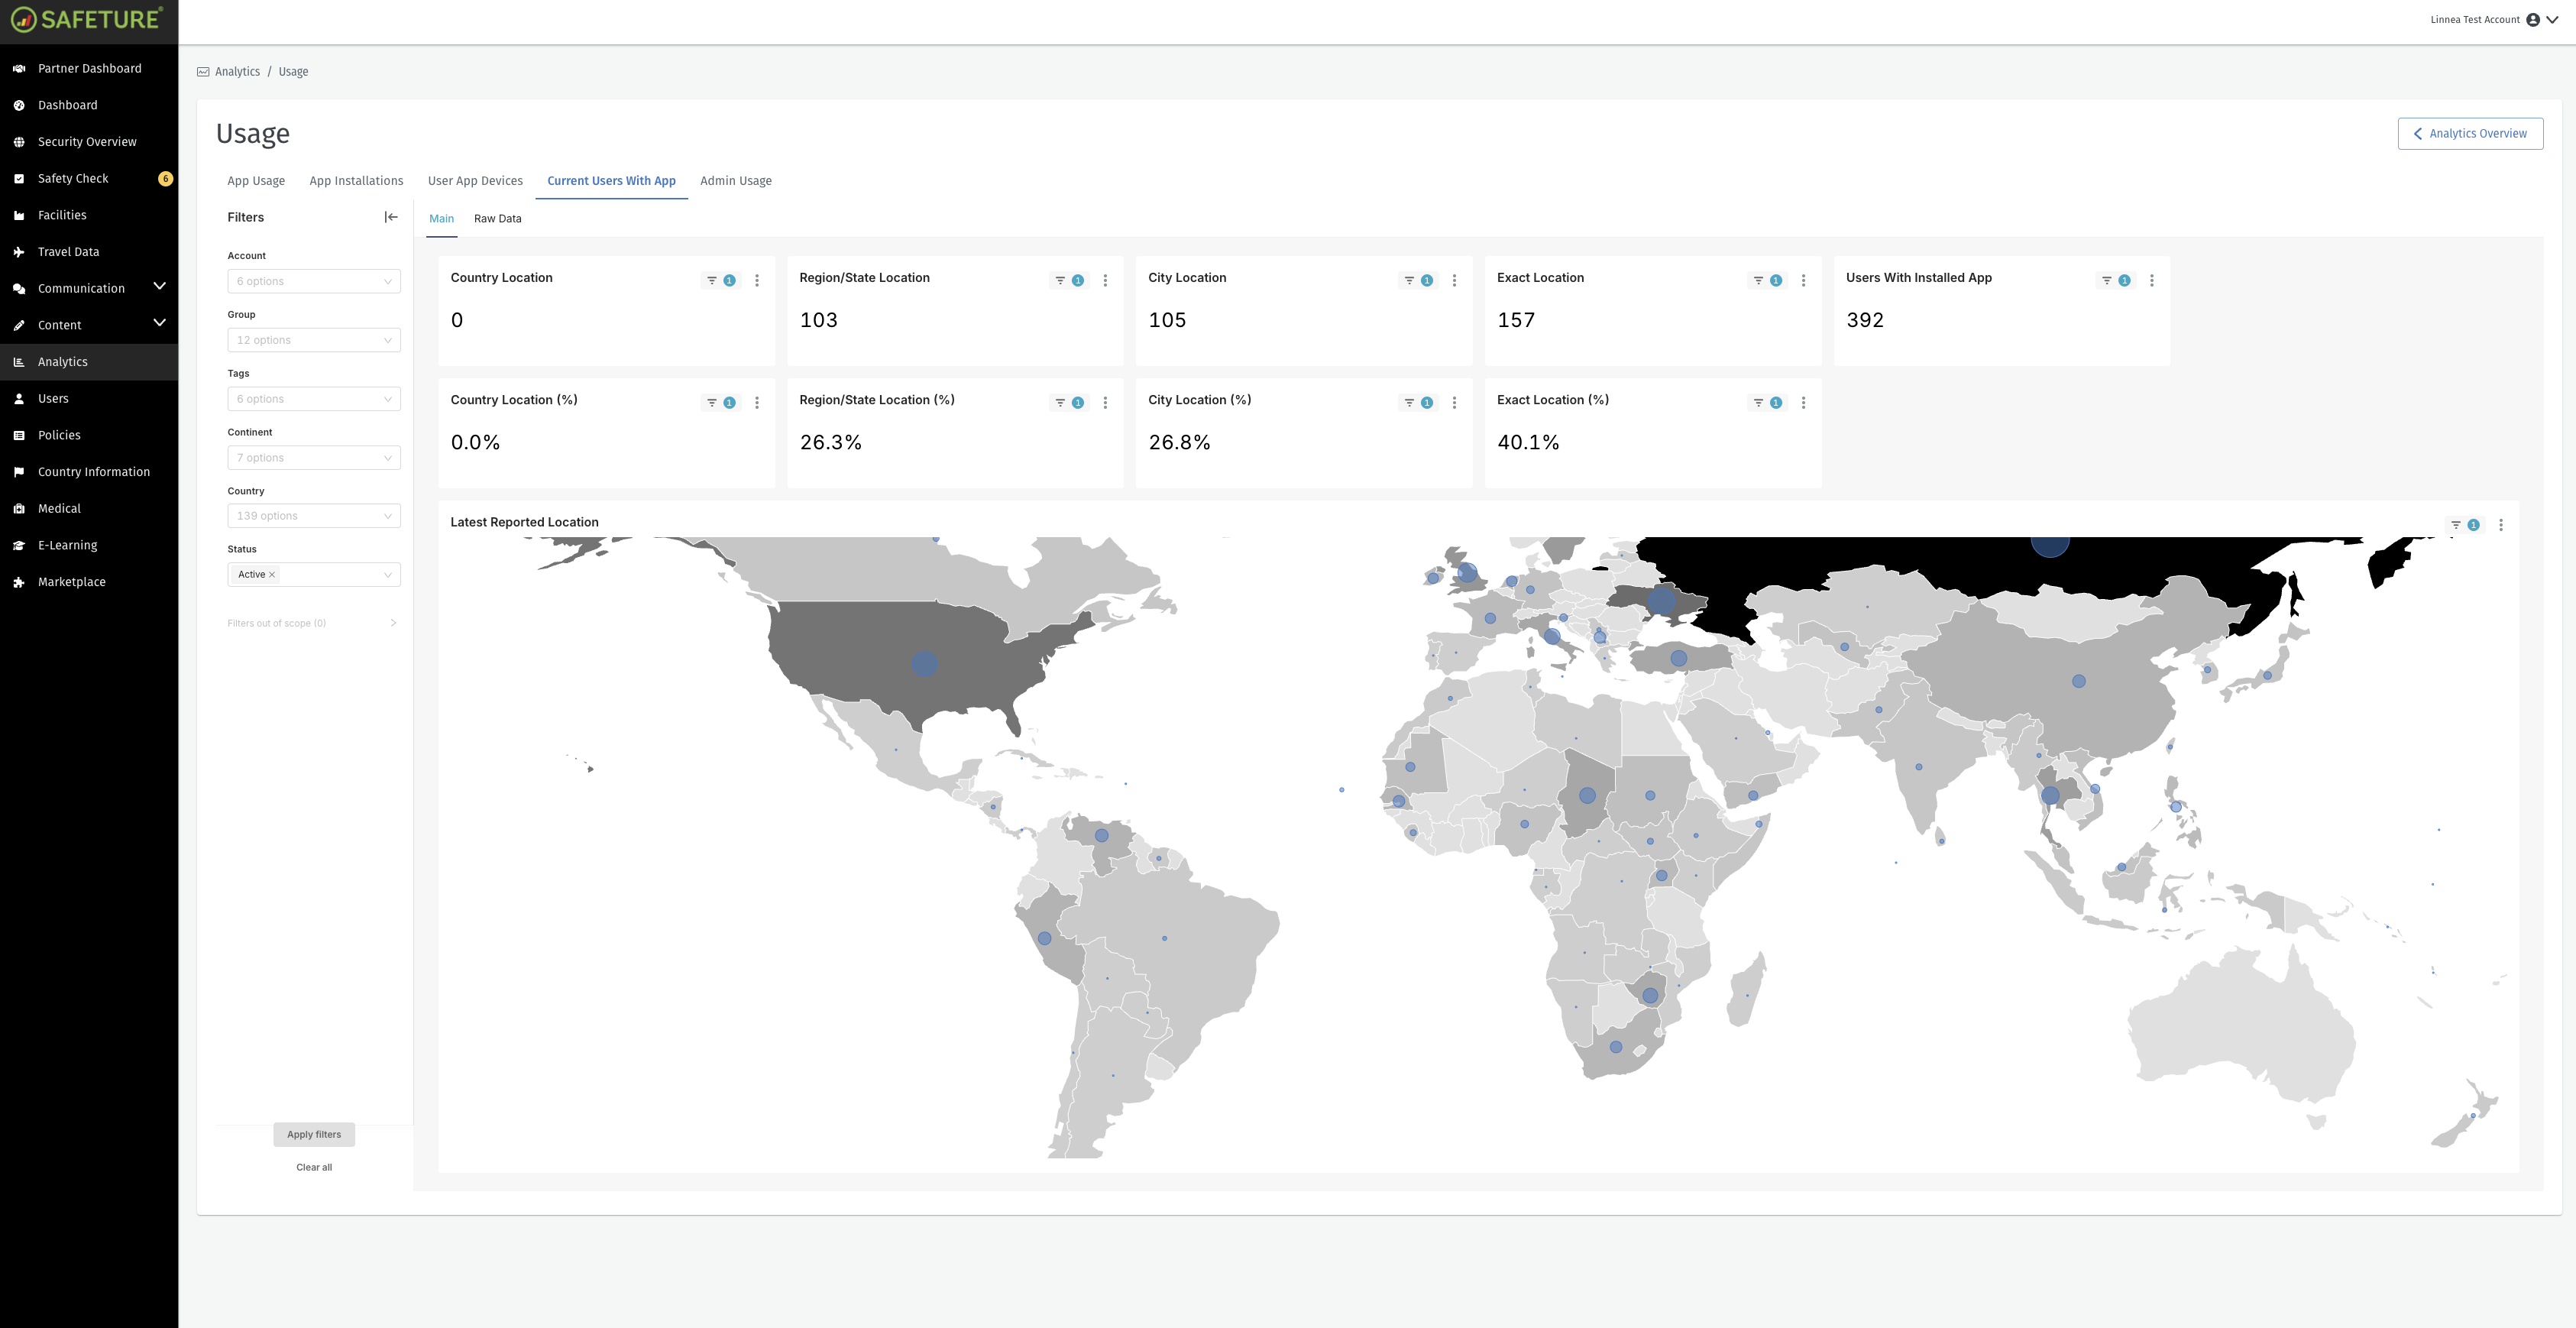
Current Users with App and Location Settings
This tab provides details on users with the Safeture app and their privacy settings, which impact the accuracy of location data.
KPIs:
Region/State Location: Number and percentage of users sharing location data at the region/state level.
City Location: Number and percentage of users sharing city-level location data.
Exact Location: Number and percentage of users sharing exact locations.
Users with Installed App: Total number of users with the app installed.
Map of Last Reported Locations:
Displays the latest reported location for users, with a map showing how many users are in each country. Selecting a country filters the KPIs to show data specific to that region, including user privacy settings.
Please note: Note: Users who enable exact location sharing benefit from more relevant alerts, and Admins can prioritize those users who are exposed to greater risks. The data in this section helps you assess whether further action is needed to encourage more precise location sharing.
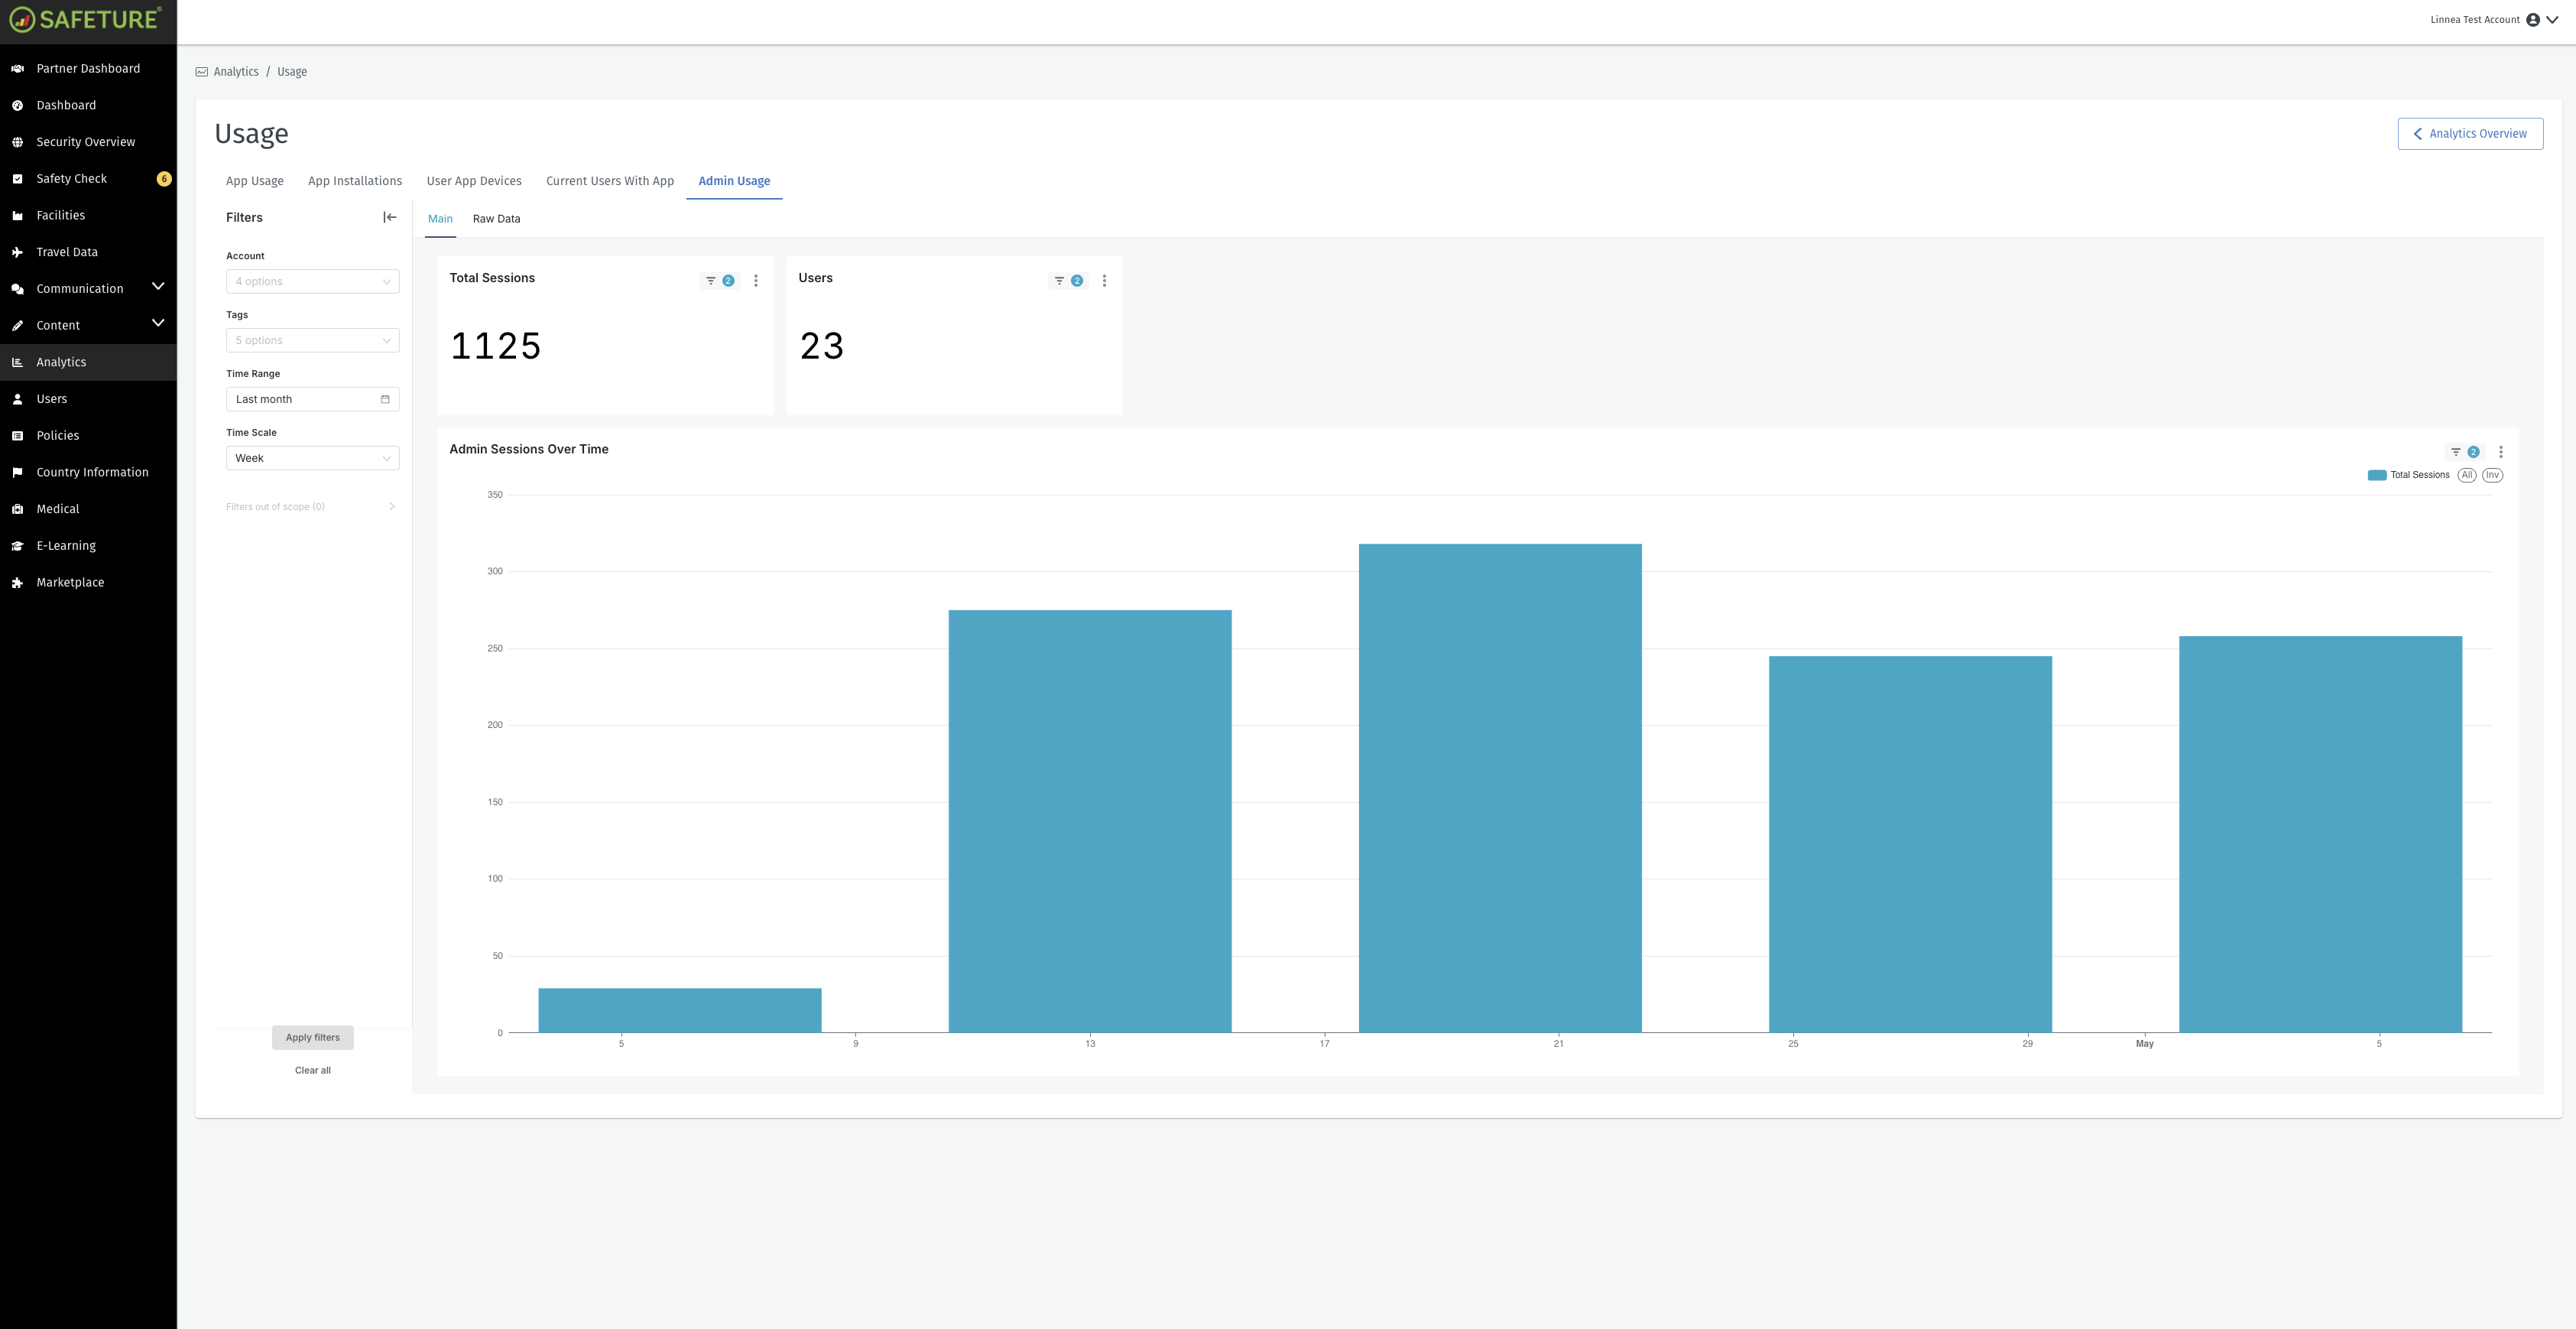
Admin Usage
The Admin Usage tab offers insights into administrator activity within the web portal.
KPIs:
Sessions: The total number of admin sessions initiated. A session includes all actions taken while logged in and ends after 10 minutes of inactivity.
Users: The number of unique administrators who have logged into the web portal during the selected time period.